 EMoney
 Fidelity
 Schwab
Trading Fees Go to Zero...Who Cares?
This cost is a non-factor for long term investors.
Much media hype has been made around discount online brokerages like Schwab and Fidelity cutting their fees from $10, to $7, to $5, and finally $0. In one of the most misleading ads (video below) in recent memory, a savvy couple asks their “broker” about fees, and then references that Schwab’s fees are $4.95 and there’s some vague money back guarantee.
Despite the dead-on portrayal of advisors deferring hard questions during a sports game or round of golf, this add has no real substance because trading fees, even at $20 per trade, are a non-factor a for a buy and hold portfolio—even over the long term.
It just doesn’t move the needle. It is, however, a very easy anchor point where investors fixate because it’s a hard dollar figure, rather than a vague percentage buried into some legal document. A much more worthwhile endeavor would be to scrutinize fund level fees and taxes. These costs have a material effect over the long term and quite easy to control and optimize.
Here’s an example with a comparison between two hypothetical equity accounts. These portfolios are based on real life examples—one from an advisor and another built solely with Blackrock iShares funds. These were used just to demonstrate fees, but not performance. Performance is hypothetical. 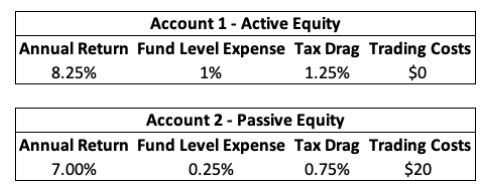
Notice the difference in trading fees. One is $0, the other is $20.
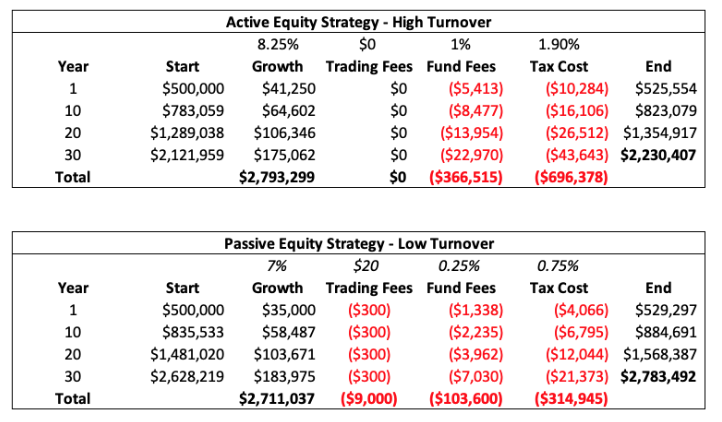
So, what happened? Despite the active manager outperforming by 1.25% gross of fees, the high taxes and fund fees “ate all the alpha.” The investor performed much better with the lower cost ETF strategy.
No surprise, but trading fees weren’t a factor. The low-cost ETF strategy had a hefty trading cost of $20, which only added about $300 per year and $9,000 over thirty years. As I said above, this is nominal.
A much more impactful endeavor is the tax cost—something Morningstar.com provides as the “tax cost ratio”. This often goes under the radar as investors looks directly at “performance” numbers. Performance numbers are generally shown net of fees, but not net of tax costs. An extra twenty or thirty basis points for taxes (.1% - .2%) is many multiples of trading costs.
So, if you looked up these two strategies on Morningstar, it would show the performance of follows:
Active Equity – 7.25% - 8.25% gross less 1% fund expense
Passive Equity – 6.75% - 7% gross less .25% fund expense
If tax costs were included, however, it would look like this:
Active Equity – 5.35% - 8.25% gross, less 1% fund fee, less 1.9% tax cost
Passive Equity – 6% - 7% gross, less .25% fund expense, less .75% tax cost
Keep in mind the active managers did outperform. The problem is that they took a large chunk, and so did the government.
When we also consider that active advisors often lag the benchmarks, and that things like active tax loss selling can reduce taxes to almost nothing (or even provide a net benefit), active equity strategies start to look really unattractive, at least in non-retirement accounts.
In contrast, thirty years of $20/trade only amounted to $9,000—a miniscule fraction of total expenses. This is an almost irrelevant fee for normal buy and hold investors. Places like Schwab and Fidelity are smartly giving it up to show some sort of moral high ground, despite having little economic impact.
So next time you a gigantic sign showing $0 trades, make a note to examine the other far more important costs embedded in your investment portfolio.