When the yield curve inverts, many economists start raising the possibility of economic recession since the inversion has historically been a leading indicator of economic downturns. Implications for economic growth aside, a yield curve inversion can play a role in term spread forecasts too, as yield curves tend to revert to their normal upward-sloping shape. Reversion back to normal can occur via a decrease in the short rate, an increase in the long rate, or both. In this piece, we explore how yield curves have un-inverted historically and the implications for bond investing. What has an inverted yield curve typically meant for long versus short rates? Could an inverted yield curve serve as a predictor for upcoming Treasury bond returns?
What is an “Inverted Yield Curve”?
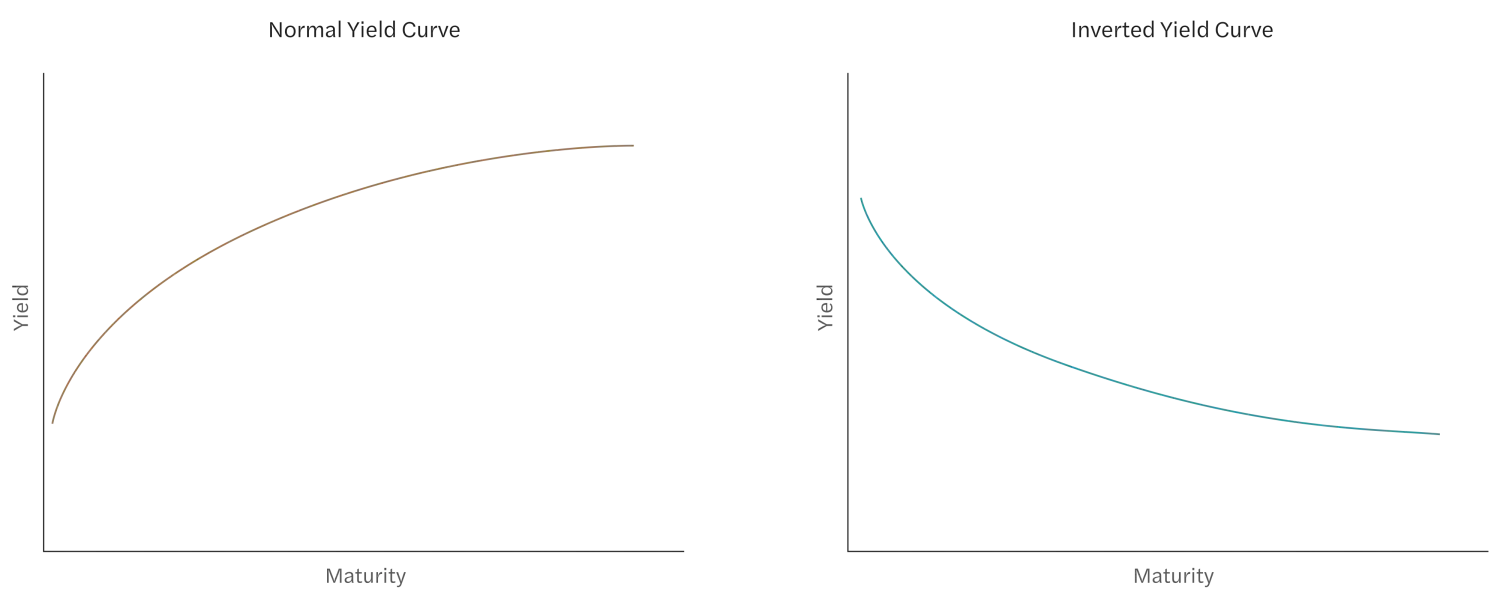
Typically, the U.S. Treasury yield curve slopes upward, meaning that interest rates for long-term bonds are higher than those for short-term bonds (see Figure 1). This reflects the greater risk of long-maturity bonds.1 An inverted yield curve occurs when the relationship flips, i.e. short yields are higher than long yields. This occurs when investors shift demand away from short-term bonds and into long-term bonds, which is often interpreted as a “recession indicator”, or a signal of investors’ expectations that there may be a slowdown in economic activity in the near term.2
Figure 1: A Normal vs. Inverted Yield Curve
What is the “Yield Spread”?
Yield spread is defined as the difference between a long-maturity yield and a short-maturity yield (which we measure as the 10-year Treasury yield minus the short rate or “cash rate”)3. It is also called the term spread, curve steepness and slope factor. The yield spread is typically positive, meaning that the yield curve is upward-sloping. If the yield spread is negative, the yield curve is inverted.
Characterizing the Inverted Yield Curve
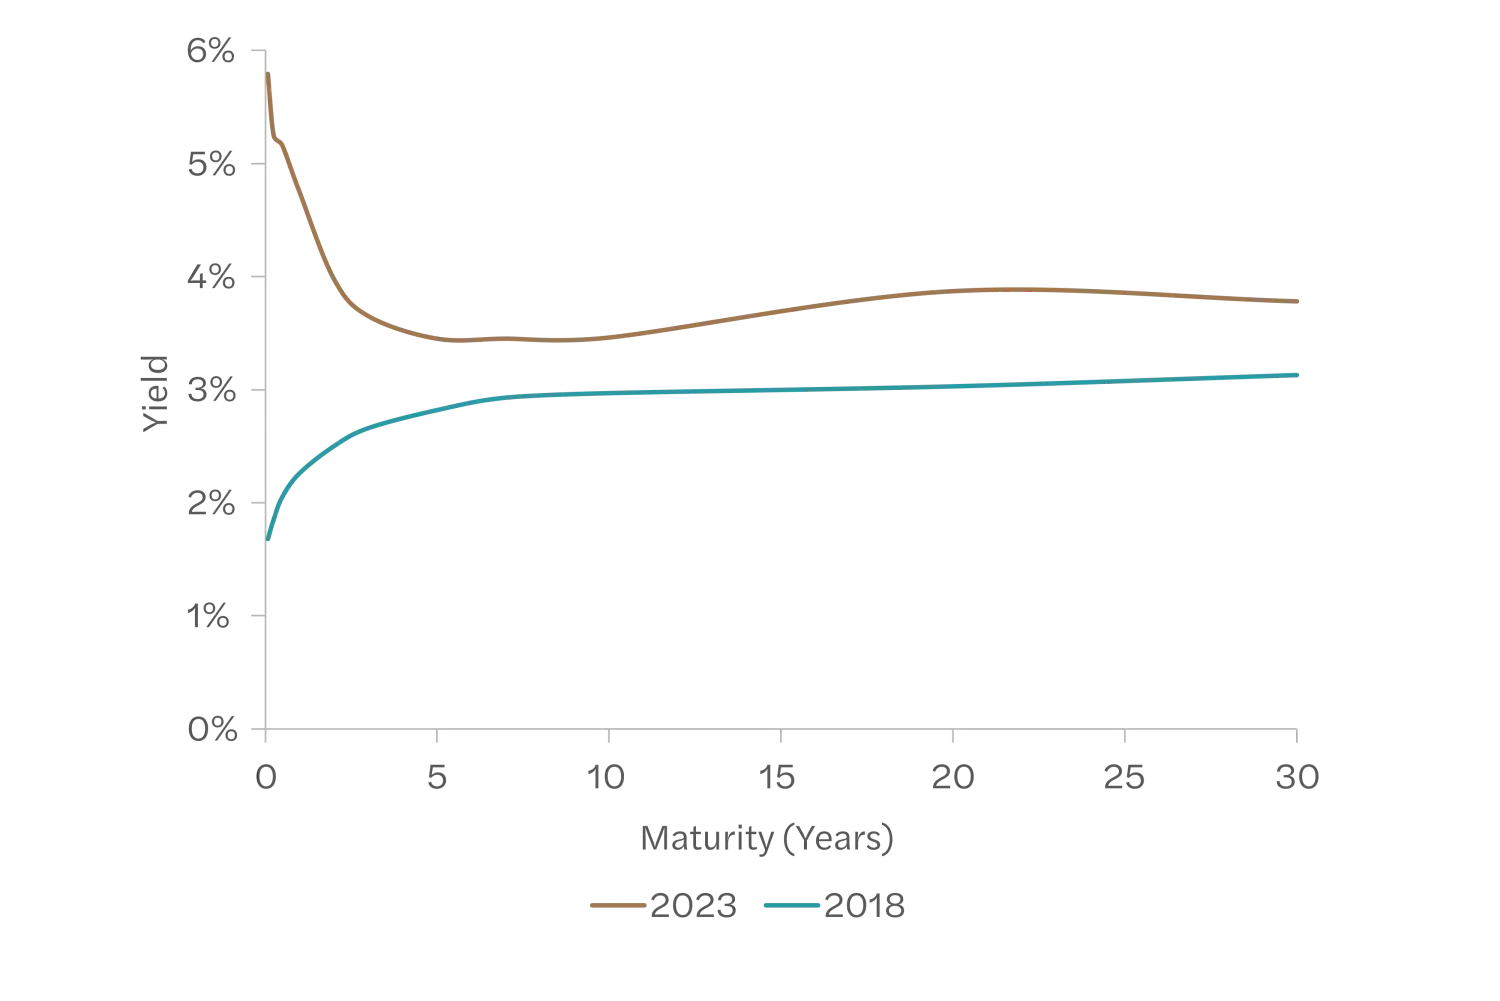
The current U.S. Treasury yield curve inversion is shown in Figure 2. The upper line, from May 12, 2023, shows an inverted yield curve, contrasted with a “normal” upward-sloping yield curve, as of May 1, 2018, below it. As of May 2023, short-maturity (1-month) Treasuries had yields of 5.79%, while the 10-year Treasury had a yield of ~3.50%. In this example, the term spread would be approximately 3.50% minus 5.79%, or -2.29%, with the negative sign indicating the yield curve inversion.
Figure 2: May 2023 (Inverted) and May 2018 (Upward Sloping) Yield Curves4
For the rest of this analysis, we use U.S. Treasury yields from the Ibbotson Stock, Bonds, Bills, and Inflation (SBBI) Dataset. The dataset ranges from January 1926 to March 2023, spanning over 97 years of data on a monthly basis.5
Figure 3 Panel A shows the difference in long (10-year) and short (30-day) yields over time. The positive spread between the two yields, with the long-maturity having higher yields than the short-maturity, is consistent with the upward-sloping ‘typical’ yield curve shape. A few large outliers are evident, such as the 1930s and the 1980s, but the graph shows that yield curve inversions have occurred throughout time and interest rate regimes. The recent inversion of the yield curve is reflected in the negative ending value of the Yield Differences graph.
Figure 3: Long vs. Short Yields Over Time
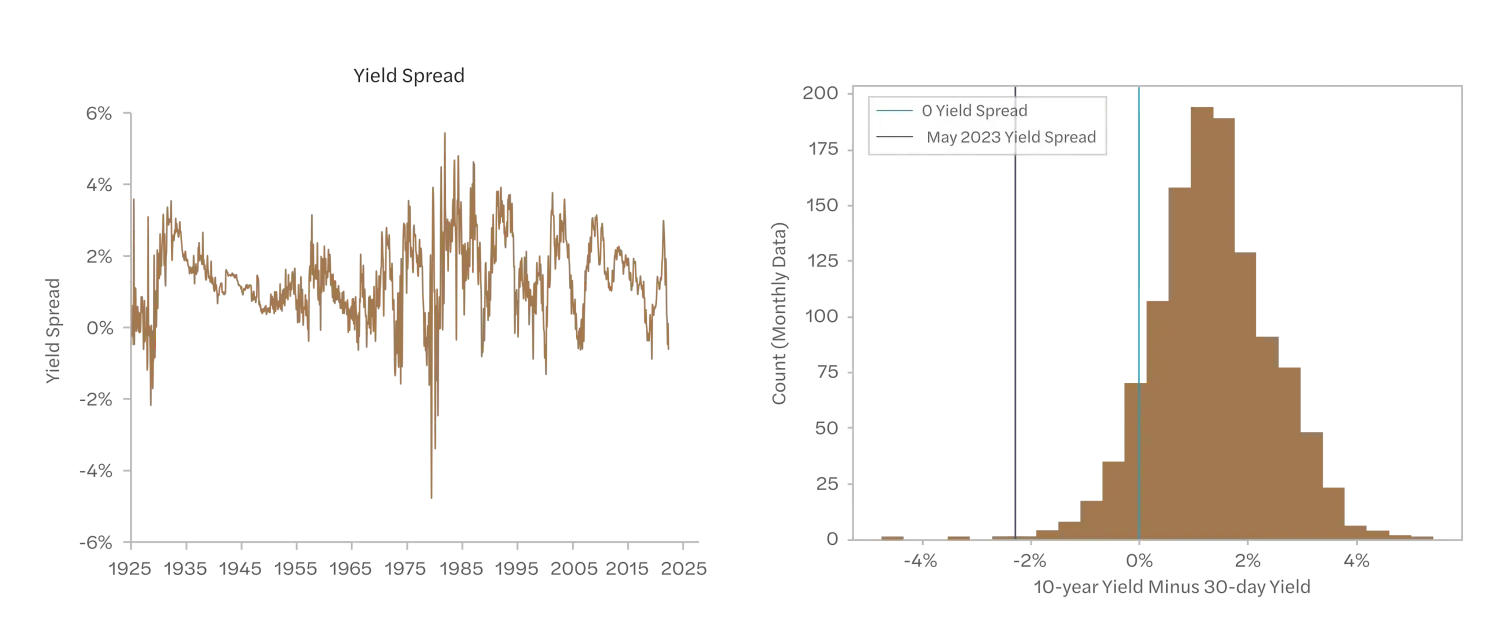
The relative rarity of the current yield curve inversion is shown in Figure 3 Panel B, which shows the distribution of the yield spreads over time. Over our sample, 113 months had inverted yield curves, out of 1167 months total, meaning that yield curves were upward-sloping over 90 percent of the time. As of May 2023, the 10-year yield was lower than the short rate by 229 basis points, a ~0.26 percentile value relative to its history. That is, out of the 1167 months of history shown, only 3 months of the sample have had worse yield curve inversions than May 2023.
How Have Inverted Yield Curves Reverted to Normal?
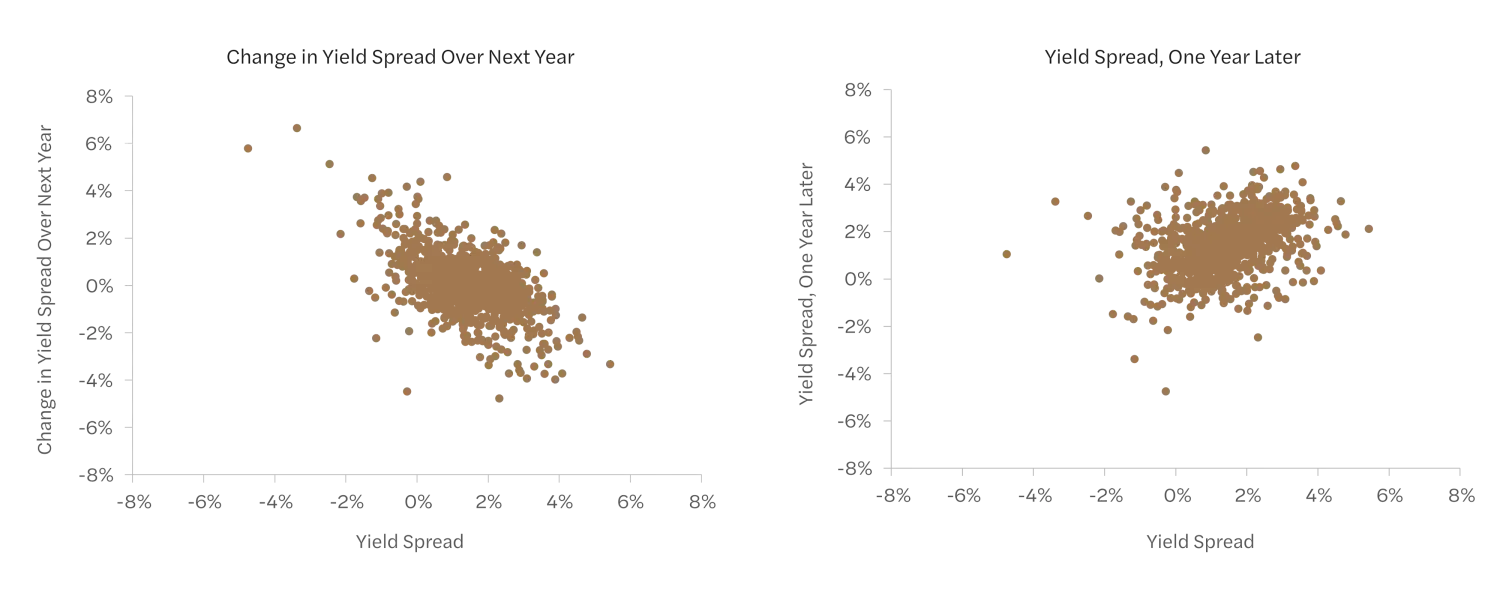
Yield curves have historically reverted to normal (i.e., an upward-sloping shape) within a year, with nearly all (~83%) inverted yield curves being non-inverted 12 months later. Figure 4 Panel A shows this: when the yield spread has been negative, the change in yield spread over the next year has tended to be quite positive (i.e. in the graph’s upper left quadrant). This can also be seen in Panel B, which shows that while yield spreads have seemed fairly persistent, the lower left quadrant is fairly sparse, i.e. yield inversions have tended not to persist.
Figure 4: Change in Yield Spread vs. Yield Spread, and Yield Spread One Year Later vs. Yield Spread
By construction, a correction to an inverted yield curve requires either 1) decreasing short rates; 2) increasing long rates; or 3) both. What has happened in practice? We can restrict our sample to the 111 months that had an inverted yield curve and examine one-year forward changes in the short rate and the long rate.
Figure 5 shows the 12-month forward changes in short-term and long-term yields, starting from an inverted yield curve. The scatterplot demonstrates that the two yields have tended to move in tandem; a decrease in short-term yields often has been accompanied by a decrease in long-term yields, which is consistent with the prominence of the level factor of interest rates. However, the short rate has tended to move much more drastically than the long rate, so despite the two rates moving in the same direction, the yield curve is able to un-invert.
Figure 5: Forward Changes in Short-Term and Long-Term Yields, Conditional on an Inverted Yield Curve
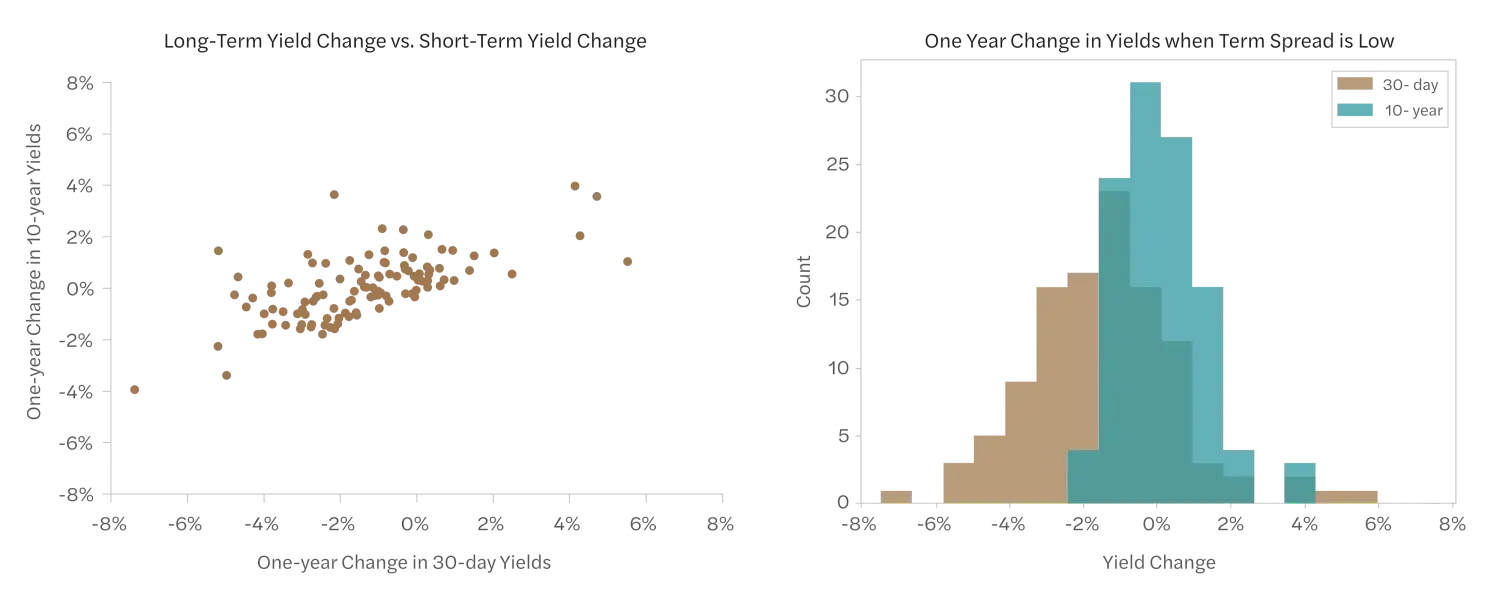
Figure 6 again highlights a difference in the yield change behavior in normal and inverted-curve situations. The first panel shows that the change in the short rate has had a materially different distribution following yield curve inversions relative to normal times. In normal times, the change in the short rate has been centered roughly at 0% and rarely exceeds ±4%. In contrast, following yield curve inversions, the change in the short rate is shifted left on the graph, reflecting its average negative change, with a wider distribution of potential outcomes. The second panel shows that the change in the long-term yield has had a similar distribution regardless of whether the yield curve began in an upward-sloping or inverted state.
Figure 6: Forward Changes in Short-Term and Long-Term Yields, Inverted Yield Curve vs. Full Sample
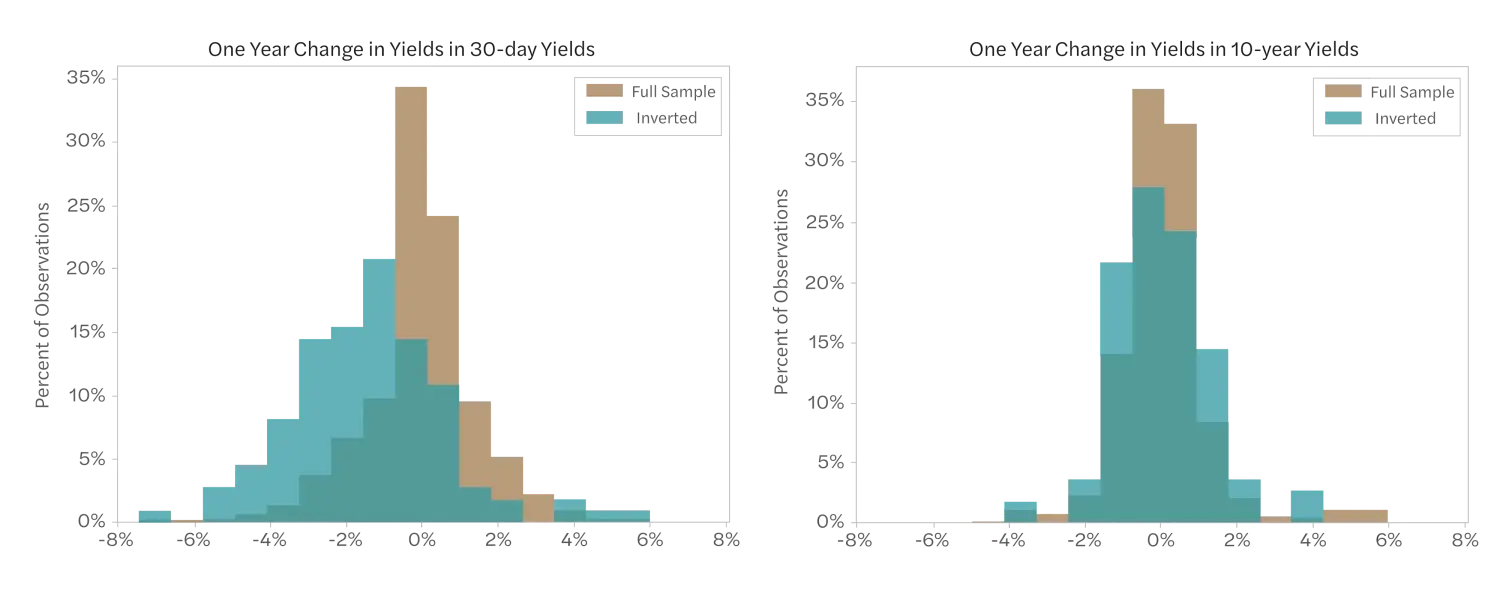
Table 1: Historical Characterization of Yield Spread Changes Over the Following Year
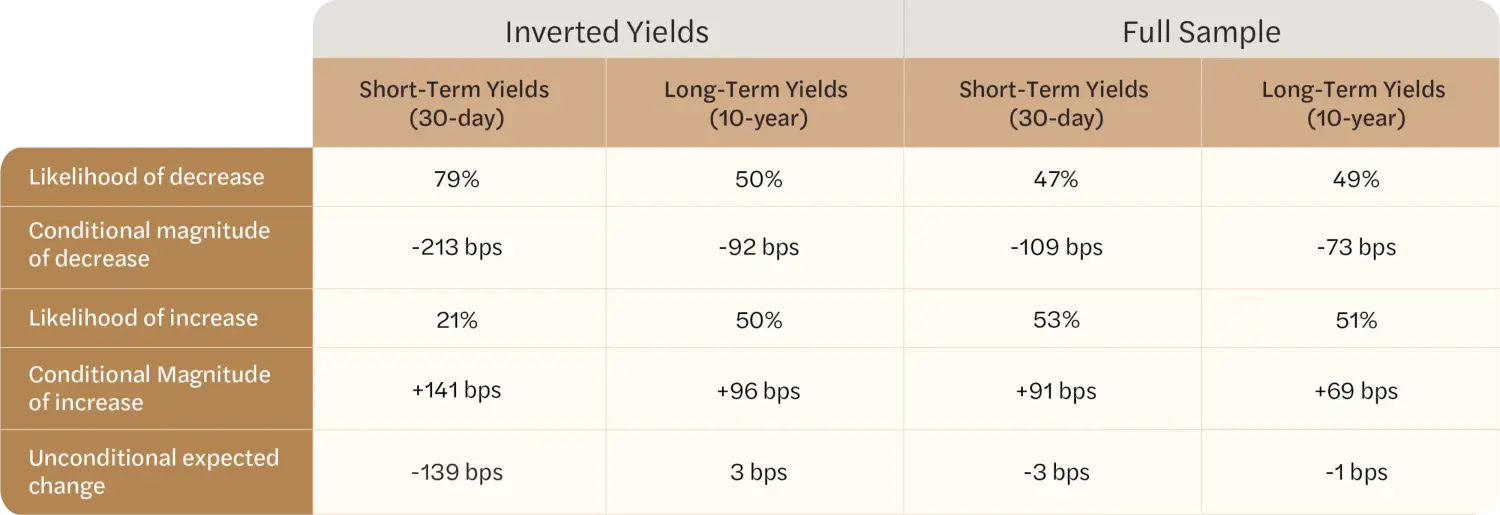
As shown in Table 1, the majority of a yield curve inversion correction has been driven by short yields, which have a large likelihood of decrease and a large conditional magnitude of decrease. Historically, on average, short yields have decreased by 139 basis points in the year following an inverted curve, although the outcomes have been dispersed, as seen by the large differences in conditional outcomes (down 213 basis points versus up 141 basis points). This is a drastic departure from the behavior of short-term yields over the full sample, which has a much more even likelihood of decrease or increase (47% and 53%, respectively) and, on average, has fallen by 3 bps over an annual period.
Long yields have been, to a first approximation, a coin flip, with roughly even odds of a decrease or increase in the year following an inverted yield curve. Historically, the conditional magnitude of increase in the 10-year Treasury yield has been slightly higher than the conditional magnitude of decrease, which helps fix the yield curve inversion directionally, but the magnitude has been quite small – a mere 3 basis points on average.6 This is similar behavior to the full history of long-term yield changes, in which the likelihood of increase and decrease are again similar, with an approximately flat expected change. In short, long-term yield movements have not historically behaved differently based on the shape of the yield curve.
The combination of the short-term and long-term yield movements indicates that, when the term spread has been negative, it has historically increased 142 basis points over the next year. The average yield curve inversion magnitude – that is, the average term spread magnitude, conditional on being negative – is 58 basis points. Hence, in expectation, the change in yield movement is more than sufficient to move the yield curve back to an upward-sloping shape; a year after an inversion, the unconditional average is a yield spread of 84 bps, which maps to the 30th percentile of yield spreads.
What Could Inverted Yield Curves Mean for Upcoming Returns?
Industry and academic research have indicated that the yield spread has strong predictive power on future bond market returns, with a steep upward-sloping curve leading to higher Treasury bond returns.7 A natural hypothesis, given those findings, is that an inverted yield curve should be a predictor of lower-than-average bond returns. To test this, we characterize one-year forward excess returns on 10-year bonds, splitting the sample by inverted yield curves and upward-sloping yield curves.
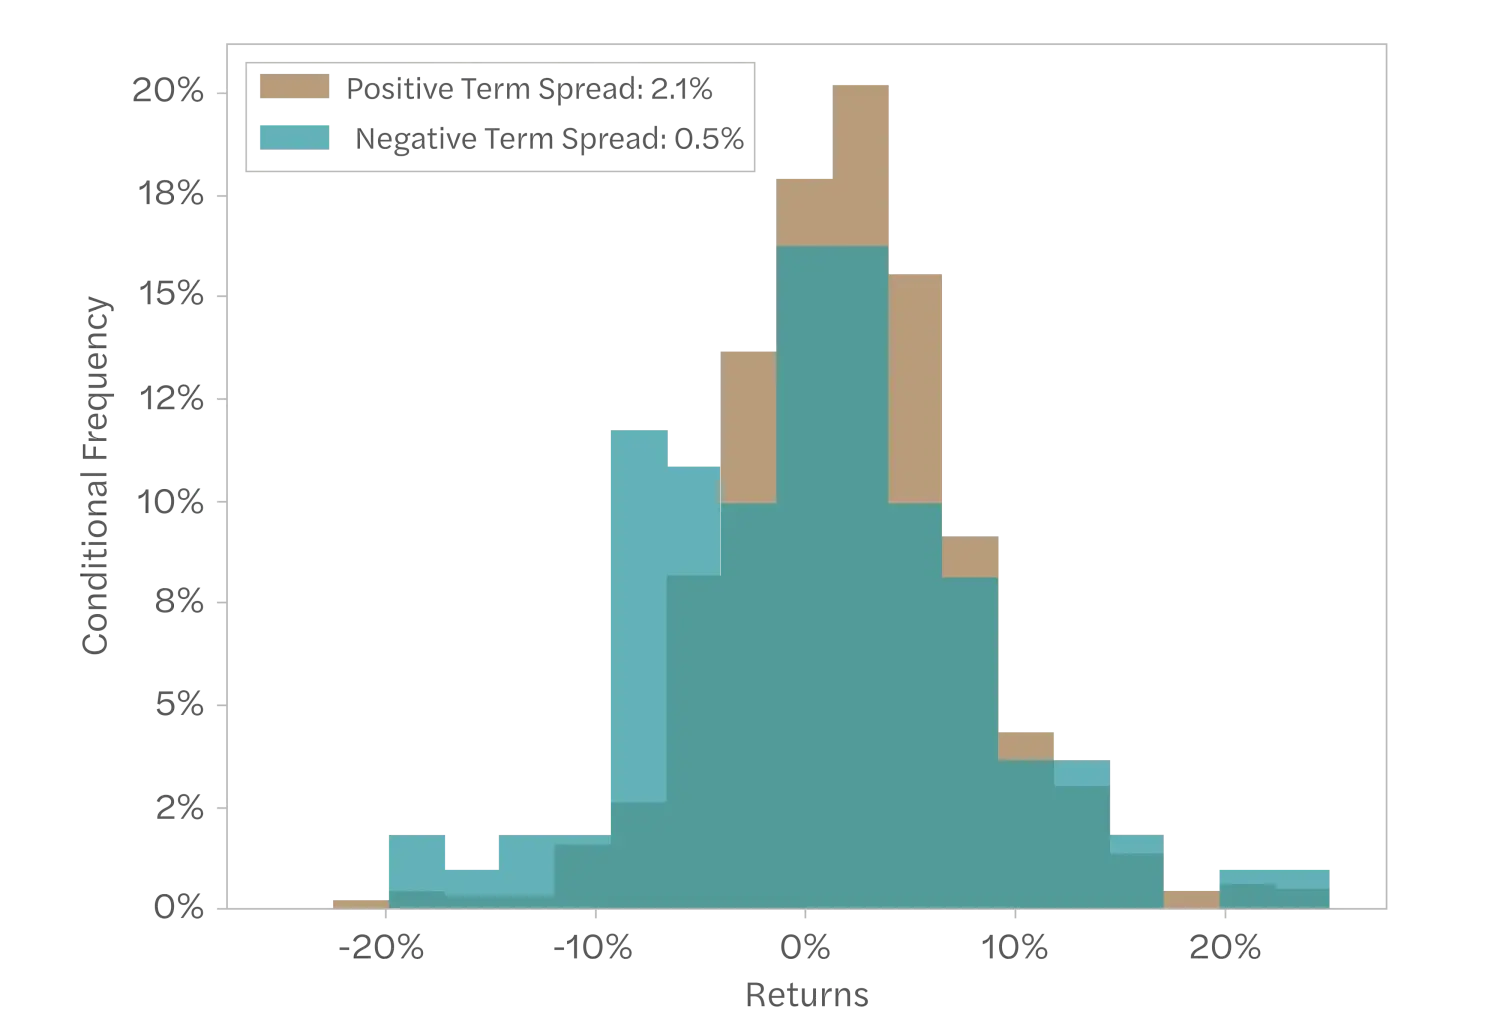
Figure 7 demonstrates that negative term spreads have predicted lower returns than positive term spreads. Following a negative term spread, the average 10-year excess bond return is 0.5%. This is substantially lower than the 2.1% mean excess return following positive term spreads (closely reflecting the full sample result, which is intuitive since the upward-sloping curve constitutes the vast majority of the sample). The variability of returns has been similar across term spread conditions – low bond returns are far from a sure thing, even following an inverted yield curve.
Notably, the total bond returns tell the reverse story, with an inverted yield curve corresponding to higher total returns than upward-sloping yield curves. This is driven by the historically higher short rates conditional on an inverted yield curve. Investment decisions are typically made on an excess return basis, so while interesting, this result has little implication for the impact of the negative term spread on bond attractiveness.
Figure 7: 1-year Forward Excess Returns, 10-year Bonds
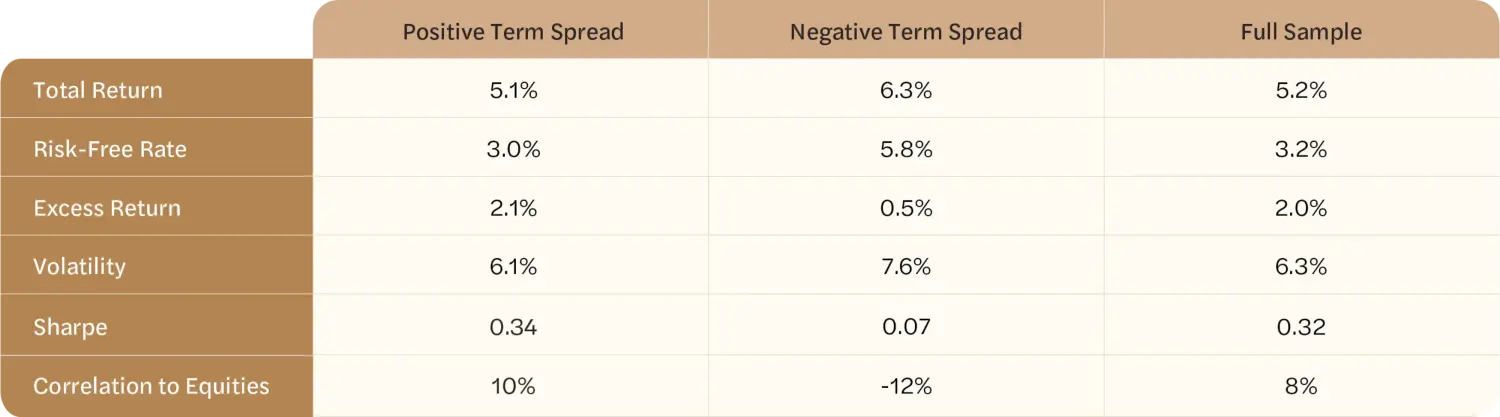
To measure the potential impact on the stock market, we also measure the bond excess return correlation to equity excess returns using the SBBI US Large Stock total return index, again looking at one-year forward returns. Unconditionally in our sample, bonds and equities have been positively correlated. However, conditional on a negative term spread, the bond and equity correlation has turned negative, indicating that equity returns may serve as a better diversification tool than usual to offset weak bond returns after a yield curve inversion.
Even following inverted yield curves, the long-term bond excess return has been positive – and continued to provide diversification as a fixed income sleeve in a multi-asset portfolio – so the negative term spread is not a predictor of losses. Still, the predictive power of term spreads today for forward-looking bond returns indicates a potential opportunity for a tactical bond investment strategy. In future work, we will discuss how the term spread, combined with other bond market signals, could be used as an indicator for bond investment attractiveness.
Summary
In this piece, we have demonstrated four key points:
- Inverted yield curves have typically reverted to normal (the 30th percentile in expectation, which is upward-sloping) within a year
- Yield curve corrections have typically occurred via a decrease in short rates, which have tended to be more variable than long rates after a yield curve inversion
- Long-term yield behavior after an inverted yield curve has not been materially different from its normal behavior, and the direction of the yield change has been a coin toss
- An inverted yield curve has historically been a predictor of lower, but still positive, bond returns (in excess of cash) over the following year.
There are multiple potential macroeconomic explanations consistent with these findings, which we do not explore directly. In future pieces, we will explore how these findings might guide an investment strategy based on bond attractiveness indicators.
Disclosure
This material is published for informational purposes only.
The views expressed and other information included are as of the date indicated and based on the data available at that time. They may change based on changes in markets, general economic conditions, rules and regulations, and other factors. NDVR does not assume any duty to update any of the views and information herein. Unless otherwise noted, views and opinions expressed are those of the authors and not necessarily those of NDVR or its affiliates.
NDVR is an investment advisor that may or may not apply the views and other information described herein when providing services to its clients. The views and information herein are not and may not be relied on in any manner as, investment, legal, tax, accounting or other advice provided by NDVR to any individual or entity or as an offer to sell or a solicitation of an offer to buy any security.
Footnotes
-
Bonds only pay interest until maturity, at which point the face value is paid out. This longer period of time to recover the bond’s face value implies greater risk to bondholders, and there is greater exposure to interest rate changes, relative to shorter-term bonds. Investors typically demand higher returns to compensate for the increased interest rate risk of long-maturity bonds versus short-maturity bonds. ↩
-
See, for instance, Why Does the Yield-Curve Slope Predict Recessions?. There are multiple channels through which a yield curve inversion can be a predictor of a U.S. recession or economic activity. For instance, when market participants expect an economic downturn, they may also expect that the Federal Reserve’s policy rate (short-term interest rates) will decrease, a monetary policy response by the central bank to help encourage economic activity. This expectation reduces longer-term rates, which can cause a yield curve inversion. Separately, changes in the yield spread may reflect Wall Street’s attitudes toward risk, which may then have predictive power on their behavior in the financial market and therefore economic downturns. ↩
-
While the 10-year yield is often used as the long yield, studies have used different measures for the short-term yield. Many academics use the 3-month Treasury bill rate, as a proxy for the Fed Funds Rate. Others, including industry researchers and strategists, have used the 2-year yield as the short yield. Since the 30-day, 3-month, and 2-year yield are highly correlated, the exact choice of maturity is unlikely to matter. ↩
-
Constant Maturity Treasury data from the Federal Reserve. ↩
-
To arrive at a 10-year Treasury yield, a weighted average of the US Long-term (20-Year) Government Bond Yield (1/3 weight) and US Intermediate-term (5-Year) Government Bond Yield (2/3 weight) were used. The US (30-Day) Treasury Bills series was used for the short-rate. The dataset is monthly and therefore lagged relative to the Constant Maturity data from the Federal Reserve, but it has a much longer history. ↩
-
The likelihood of the long-term yield decreasing or increasing is not statistically different from 50/50; a t-statistic testing the null hypothesis that a propensity for a yield increase was different from 50% returned a t-statistic of 0.09, far from statistically significant. ↩
-
See, for instance, Dyl and Joehnk (1981), Fama (1984), Campbell and Shiller (1991), Ilmanen (1995; 1997), Yamada (1999), Ilmanen and Sayood (2002), Duyvesteyn and Martens (2014), Baltussen, Martens, and Penninga (2021), among others. ↩