Why Dollar-Cost Average?
Dollar-cost averaging (“DCA”) refers to the practice of investing a fixed dollar amount regularly, regardless of market or portfolio movements. This is contrasted against lump-sum investing when the entire investment amount is allocated immediately.
It may not be immediately obvious, but most investors regularly face a decision on whether to dollar-cost average or invest in a lump sum. Consider an annual contribution to a retirement account, such as a 401K or an IRA. Investors typically know in advance the amount of money they want to contribute each year, and their desired asset allocation, which may include mutual funds or exchange-traded funds (“ETFs”) that provide stock market or fixed-income exposure.1 Should they contribute the fixed amount at the beginning of the year, or should they instead invest over regular intervals over the year?
Advocates of DCA claim that it is a good investment strategy to reduce risk due to fluctuations in share prices and be less exposed to market volatility. The idea of slowly buying into an investment has intuitive appeal: by avoiding purchasing an investment when it is relatively expensive, DCA can easily help to minimize regret. The benefits of dollar-cost averaging are most evident in a declining market. Given these market conditions, the average price paid is lower and the number of shares purchased is higher than when lump-sum investing, leading many to conclude that dollar-cost averaging works.
However, in rising markets, DCA can also come at an implicit cost: the lost returns of not having been invested earlier. In such an environment, fewer shares are purchased at a higher average cost than when investing a lump sum. Given that the relative performance of DCA vs. lump-sum investing depends on stock price levels over the contemplated investment horizon, it is clear that DCA is a market timing strategy that benefits from lower prices in bear markets.
How do those considerations weigh against each other?
In this paper, we show that even over short horizons, DCA often comes at high opportunity costs and results in better outcomes only a small fraction (approximately 33%) of the time. In most cases, lump-sum (upfront) investing results in better outcomes. Recognizing that some of that effect could come from the higher average exposure to the market, we also solve for a scaled upfront investment amount that matches the amount of risk realized by the DCA strategy.
Even after accounting for the amount of market exposure, we show that DCA averages a lower return than a lump-sum investment, with no material benefit to the distribution of outcomes. Moreover, we show that DCA has a higher sensitivity to sequence of return risk, experiencing a decrease in the expected return and a materially higher uncertainty of returns – a clear lose-lose.
Interest in, and criticism of, DCA goes back decades. Originally referred to as “formula timing plans”, Ketchum (1947), Solomon (1948), and Weston (1949) investigate the idea of “dollar averaging” an investment. Constantinides (1979) shows theoretically that DCA is a suboptimal strategy. Rozeff (1994) extends the work by showing that DCA over a historical sample underperformed lump-sum investing despite having more risk. Yet, the intuitive appeal of DCA lives on: Dunham and Friesen (2012) propose enhancements to dollar-cost averaging as an investment strategy, while Dubil (2005), Cho and Kuvvet (2015), and Smith and Artigue (2018) attempt to justify dollar-cost averaging as a risk-reduction strategy. Our approach adds to the debate by demonstrating from a new angle that DCA is difficult to justify from either a return or risk perspective.
Does Dollar-Cost Averaging Result in Owning More Shares on Average?
One common argument in favor of dollar-cost averaging is that it can result in acquiring more shares on average at a lower average price per share than lump sum investing. For example, according to FINRA, “When you dollar-cost average, you buy more shares of an investment when the share price is low and fewer shares when the share price is high. This can result in paying a lower average price per share over time.”2
As we demonstrate in this article, this argument is a red herring. Imagine a stock with a current price of $10. In the next period, it can either increase to $12.5 or decline to $8 with equal probability. The single period expected return is 2.5%.
Imagine an investor with $100,000. If they invest in a lump sum, they acquire 10,000 shares. At the end of the period, they either have $125,000 or $80,000. On average, their end wealth is $102,500, reflecting the stock’s 2.5% expected return.
Next, let’s consider the dollar-cost averaging investor. They invest $50,000 upfront, acquiring 5,000 shares. At the end of the period, they invest the remaining $50,000, acquiring either 4,000 shares ($12.5 share price) or 6,250 shares ($8 share price). On average, they acquire 5,125 shares at an average price per share of $9.76. By dollar-cost averaging, they get more shares on average at a lower average price!
Exhibit 1
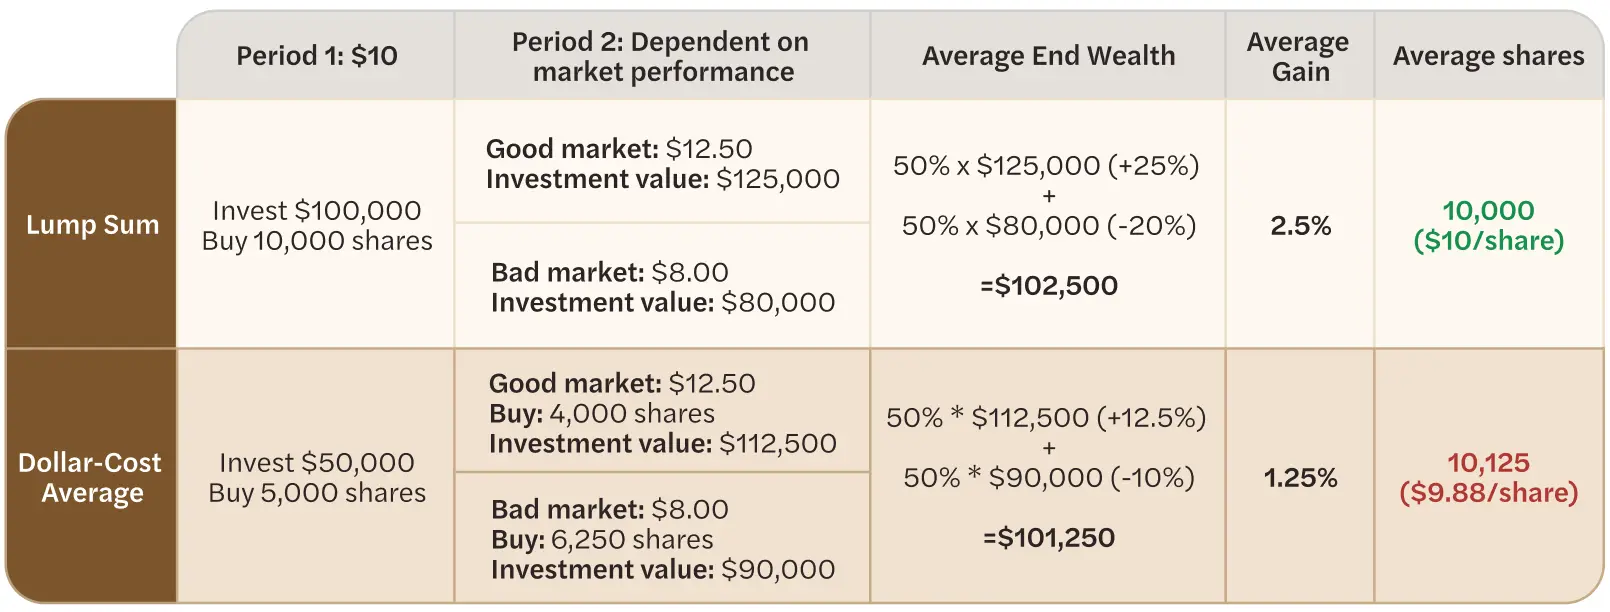
Many people view this as nearly a free lunch. It’s not – it’s a red herring. The primary difference between these two investors is that the lump sum investor took twice the risk of the dollar-cost averaging investor. The lump sum investor ends the period with either a 25% gain or a 20% loss, with an average gain of 2.5%. Meanwhile, the dollar-cost averaging investor ends the period with either a 12.5% gain or a 10% loss, with an average gain of 1.25%.
The DCA investor invested less on average, taking less risk, and earning less return. That’s what matters – the average number of shares and average price paid per share is an irrelevant distraction.
Does Dollar-Cost Averaging Minimize Regret?
One frequent justification for DCA is that you can avoid one-time investing at the “market high.” How likely is your end wealth to be higher if you invest entirely upfront (lump sum) vs. dollar-cost averaging?
We assume the investor contemplates investing in one asset (which we refer to as “equities”) and otherwise holds cash.3 Our non-DCA “lump sum” benchmark assumes that the entire investment occurs on the first day of the period. Our DCA strategy assumes that the investor dollar-cost averages evenly across 252 trading days (one year), and that initial wealth is held in cash until invested.4
Exhibit 2: Distribution of End Wealth, Histogram and Cumulative Distribution, Investing 100% Lump-Sum vs. Dollar-Cost Averaging
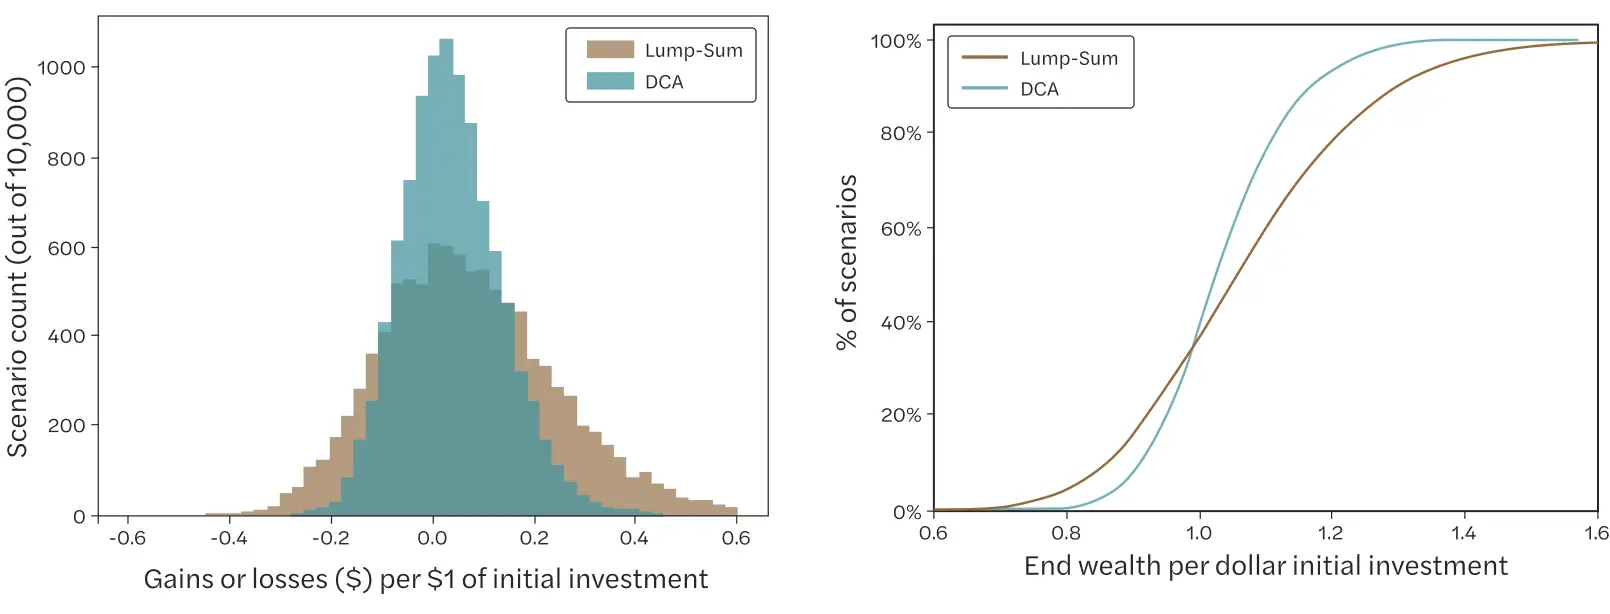
Exhibit 2a shows the end wealth per dollar of initial investment over the distribution of scenarios of a lump sum versus a 252-day DCA. Investing upfront improves the end wealth (at the one-year mark) 67% of the time, and by approximately 4% on average across all scenarios. We can show the same information on a cumulative distribution plot (Exhibit 2b), which gives us a sense of how frequently the lump-sum investment beats the DCA. To the left of the graph, the invest upfront (blue) line is higher than the orange, indicating that the lump-sum investment has a longer left tail. The orange and blue lines cross around 33% (which is the percent of scenarios that the daily DCA would have won on end wealth), after which the upfront investment has a higher mass and longer tail.
Exhibit 3: Summary Statistics: Dollar-Cost Averaging vs. Lump-Sum Investment
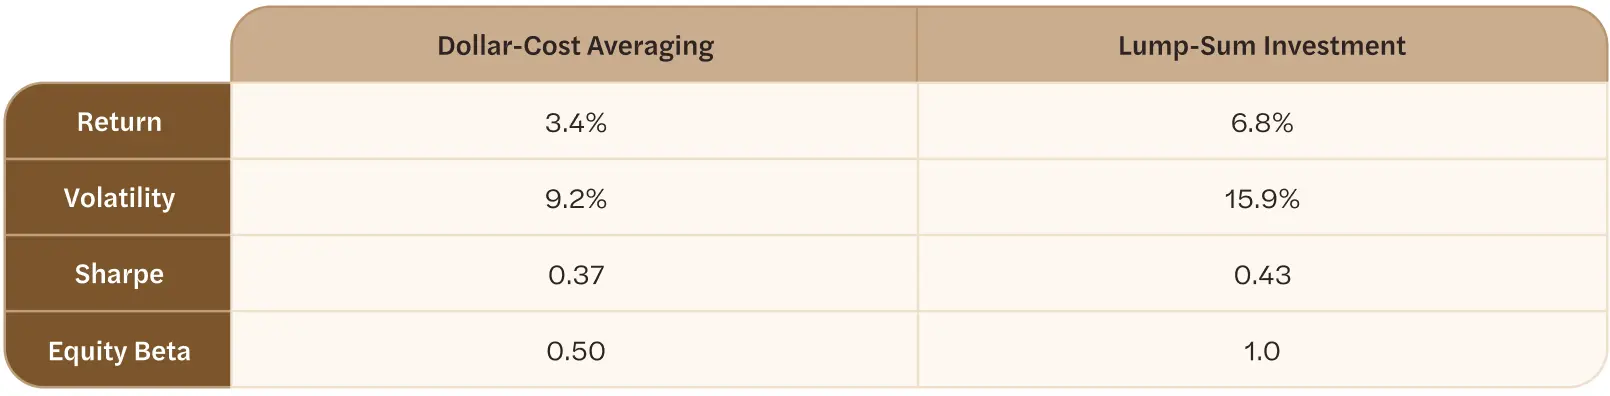
Overall, the DCA strategy has half the return – and half the equity beta – of the lump-sum investment, as shown in Exhibit 3. This is a mechanical result. Despite only gaining half the return, the DCA volatility is more than half that of the lump sum – 9.2% vs. 15.9% – which stems from the time-varying (increasing) equity exposure of the DCA portfolio. This is also a mechanical result.
The result that end wealth is improved by investing upfront is not surprising. The asset has positive expected returns while cash has zero returns – without loss of generality – in our model by assumption, so investing should result in higher wealth. What’s interesting is the distribution across scenarios. Dollar-cost averaging is often marketed for its potential to “minimize regret” by preventing the investor from putting all of their funds to work when the asset price is high relative to surrounding days. Does it work?
Exhibit 4: End Wealth per Dollar Investment, DCA vs. Lump Sum
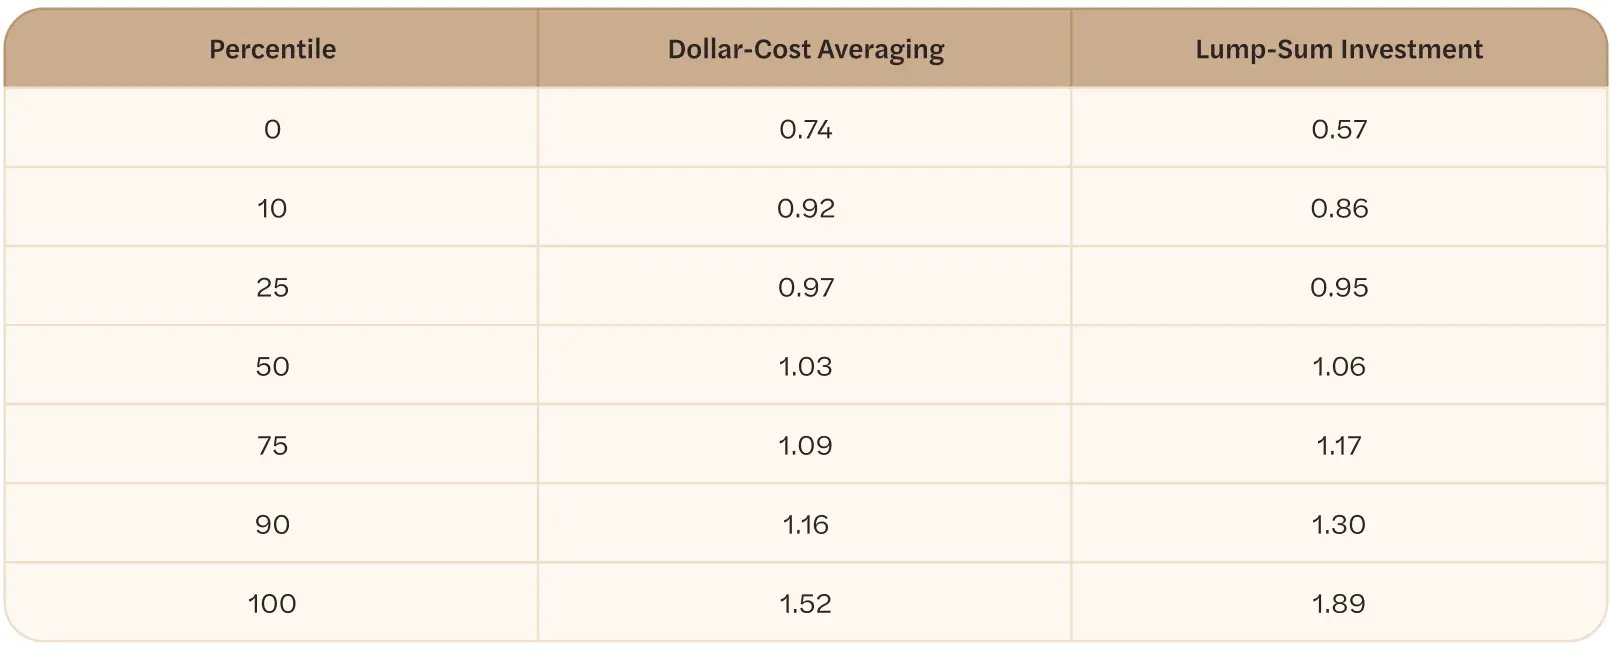
Investing upfront does have a wider resulting end wealth than the DCA strategy, as shown in Exhibit 4. For the worst 33% of outcomes, the DCA results in better end wealth, sometimes meaningfully so: the worst outcome for the lump-sum investment is a $57 return to a $100 investment, while the DCA, at $74, returns about 30% more relative to that worst-case. However, in general, the lump-sum investment dominates the one-year DCA. Conditional on doing worse, the lump-sum investment underperforms DCA by about 4%, but conditional on doing better, the lump sum outperforms DCA by about 8%. Combined with its 67% probability of winning, we arrive at the aggregate statistic shared earlier: the lump-sum investment improves expected average end wealth by 4%.
While DCA might minimize regret on the asset purchase price in the worst 10 percent of outcomes, the DCA investor is likely to miss out on a meaningful amount of returns in most cases. When it comes to regret, DCA is penny-wise pound-foolish: by avoiding regret on potentially purchasing at the top of the market, the DCA investor might implicitly pay tremendous opportunity costs that, while less tangible, should be its own source of regret.
Solving for the Risk-Matched Upfront Investment
The results in the previous section – more risk and higher return – were largely driven by the higher market exposure of the upfront investment. While this is an intuitive benchmark – investors contemplate investing upfront or holding some cash as part of a DCA strategy – we also want to isolate the impact of the market exposure component from the timing of the investment itself. To do so, we solve for the fraction of wealth that can be invested upfront, relative to being invested in a DCA strategy throughout the year, such that the portfolio volatility is the same. Using the scaled investment, we can then understand how the time-varying market exposure – a key feature of DCA – affects outcomes.5
We test varying days of dollar-cost averaging in Exhibit 5. In all circumstances, we assume a one-year investment period and the same total dollars invested. The x-axis, “days to invest”, corresponds to the number of days it took to enter the position, which is always assumed to occur at the beginning of the period. A “days to invest” of 1 corresponds to the 100% upfront investment. A “days to invest” of 21 would mean that, for each day of the first 21, 1/21 of the portfolio is invested. For the remainder of the year, 231 days (252-21), the investment is held. This exercise allows us to see how gradually entering the market decreases portfolio volatility.
Exhibit 5 shows that lump-sum investing (1 day of investment, to the far left of the graph) results in a portfolio volatility of 16%. This intuitively reflects the input equity volatility assumption since the portfolio is fully invested throughout. As the days of dollar-cost-average investing increase, the portfolio volatility declines. This reflects the fact that the average amount invested is decreasing since greater DCA horizons translates into holding cash for longer while waiting to invest. For a portfolio that dollar-cost-averages daily for an entire year, the expected volatility of the portfolio is 9.2%.
Exhibit 5: Annualized Volatility vs. Days of Dollar-Cost Averaging
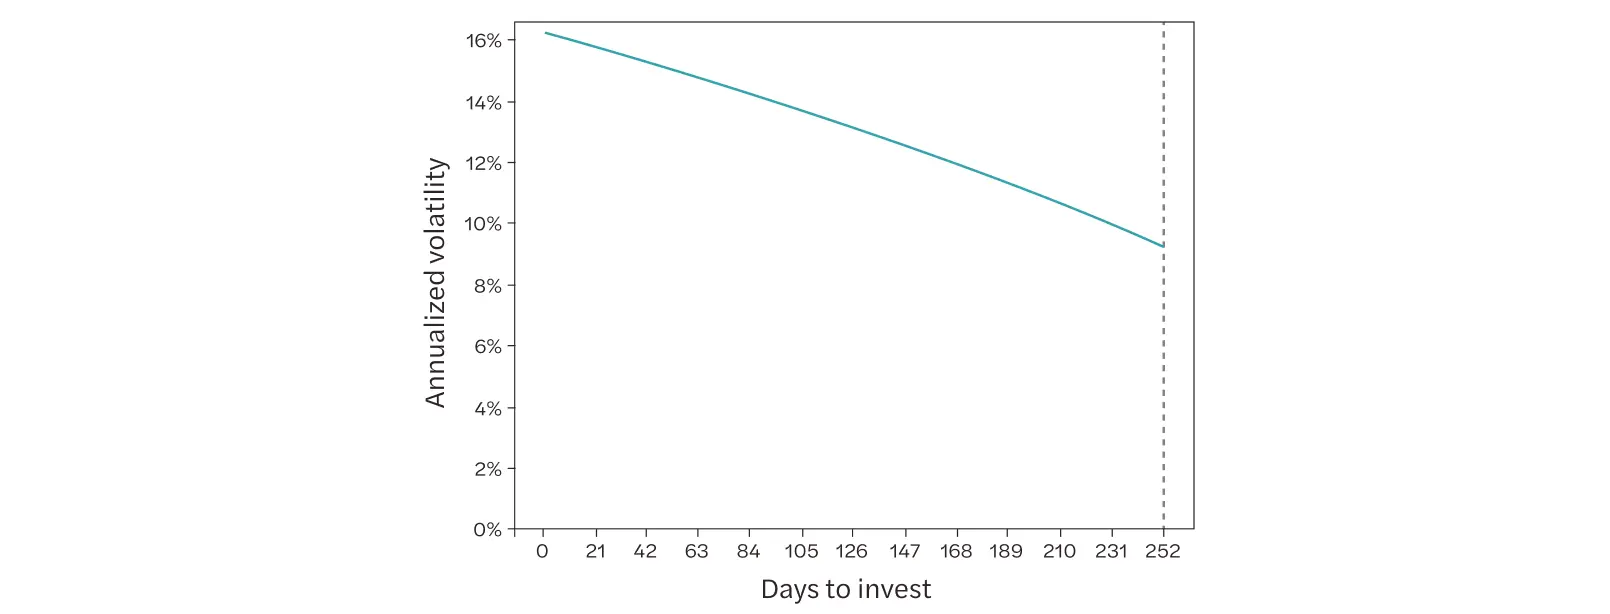
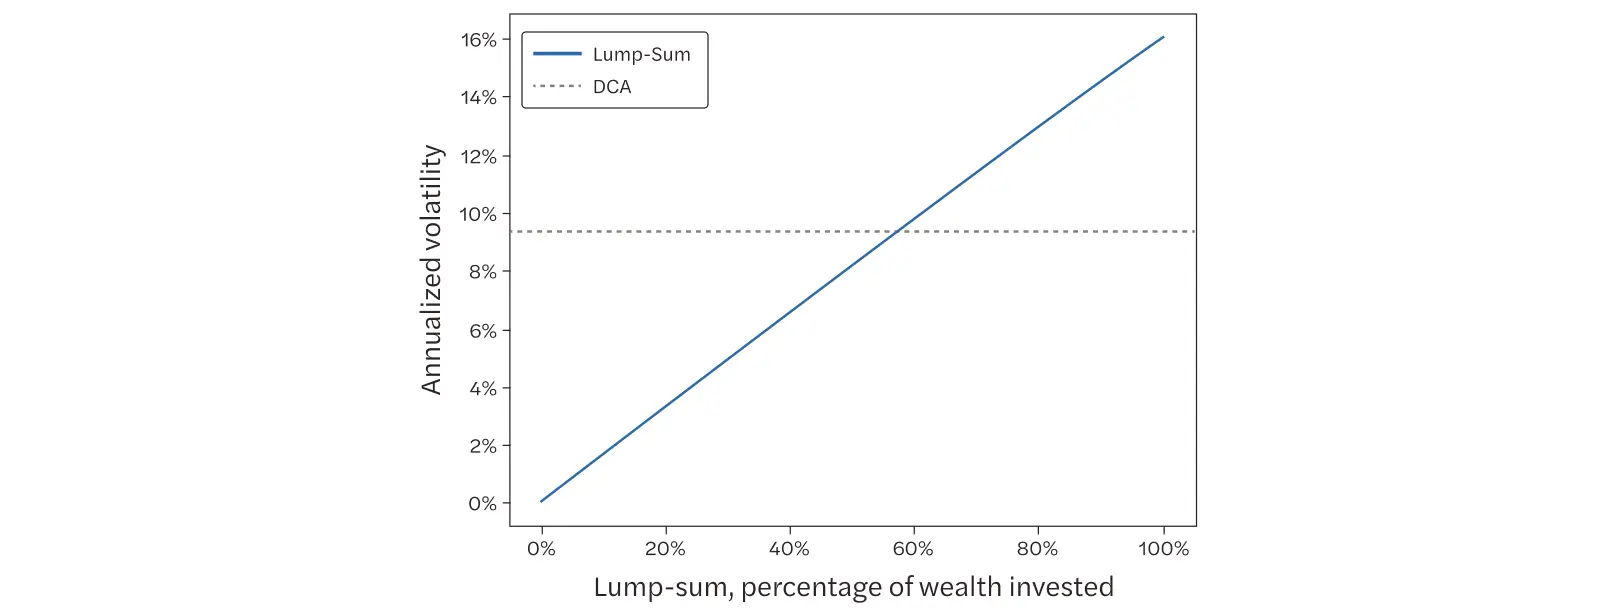
Exhibit 6 assumes a lump-sum investment is made at the beginning of the period and contemplates how the upfront fraction of total wealth invested in that lump sum affects portfolio volatility. When 100% of the portfolio is invested upfront, we arrive again at the 16% input equity volatility assumption; conversely, when the portfolio remains uninvested (0% is invested), we stay in cash and the portfolio volatility is 0%.
The horizontal dashed line in Exhibit 6 reflects the annualized volatility of the 252-day DCA portfolio. It crosses the solid line at 57%, reflecting that a 57% scaled lump sum investment has equivalent portfolio volatility to a 252-day DCA strategy. This makes sense: a 252-day DCA portfolio is 50% invested on average throughout the year; the upfront investment can make a higher-than-50% investment since it benefits from time diversification of returns throughout the year, whereas the 252-day DCA portfolio is less time diversified and has a more concentrated exposure to later return shocks.
Exhibit 6: Annualized Volatility vs. Fraction of Wealth in Lump-Sum Investment
Moreover, the lump-sum investment results in an improvement in average realized returns. In expectation, the return of the 57%-upfront-investment is 53 basis points higher than the DCA strategy, despite having the same portfolio volatility. Intuitively, this is because the lump-sum investment is both larger than the time-weighted investment of the year-long DCA (which is 50% by definition) and is also invested for longer on average (57% investment upfront, versus a mean investment of approximately 50% of wealth throughout the year for the DCA).6
To summarize the exercise from Exhibits 5 and 6 in concrete terms, we solve for the lump-sum investment fraction-to-invest by solving for the same portfolio volatility as the full-DCA case. For instance, a $252,000 investment that is DCA invested over 252 days would spend $1,000 per day in buying the asset, which results in a 9.2% annualized portfolio volatility. We then target the initial investment amount for an upfront lump-sum investment – which, it turns out, is 57% of the DCA investment amount ($143,640). The remainder of the funds ($252,000 - $143,640 = $108,360 initially) is assumed to be held in cash. The resulting end wealth in this example is $258,613 (DCA) versus $259,992 (scaled), for a difference in end wealth of $1,379.
Exhibit 7: Distribution of End Wealth, Histogram and Cumulative Distribution, Investing 57% Upfront vs. Dollar-Cost Averaging for a Year
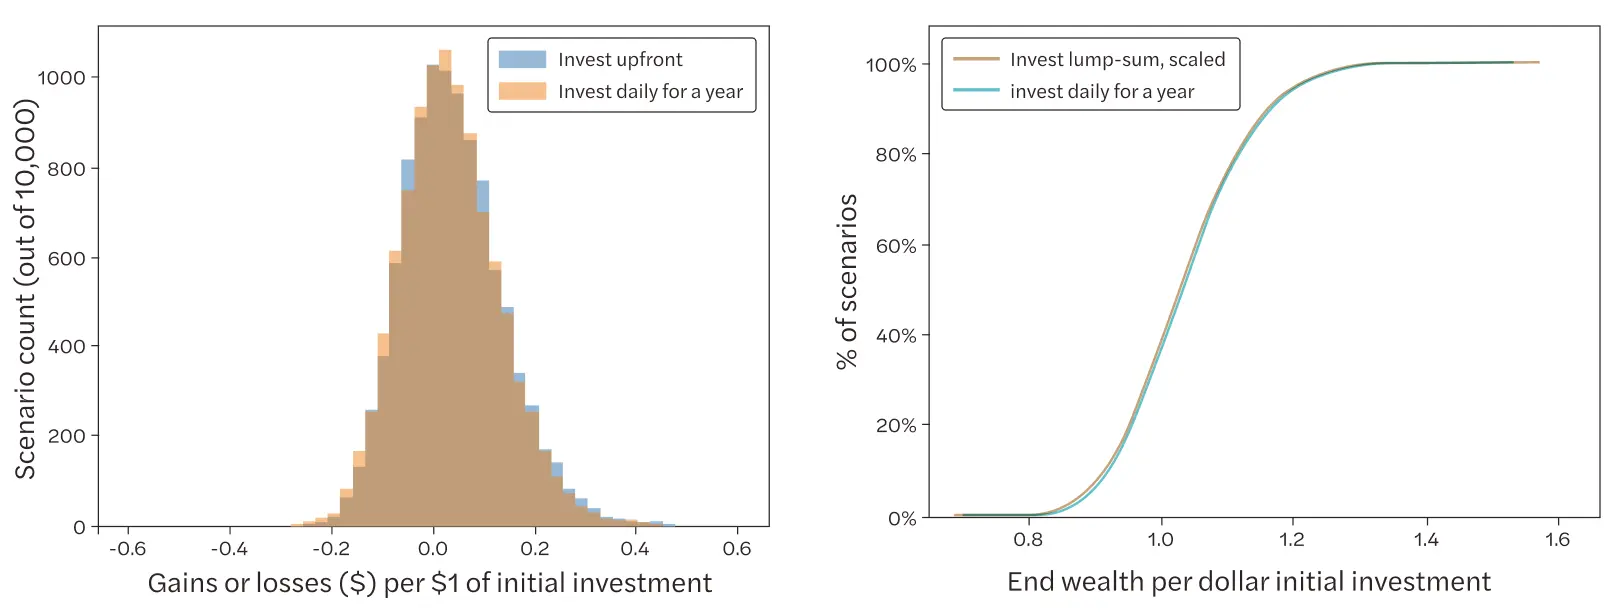
Exhibit 7 shows the distribution of end wealth across 10,000 simulations investing 57% of wealth upfront (holding the rest in cash) relative to the DCA strategy. The upfront investment results in a slightly higher average wealth, as previously discussed. The cumulative distribution demonstrates that DCA results in a higher probability of worse outcomes (a greater amount of the distribution in the left-tail), and that investing upfront performs better most of the time (roughly 60% of the time).
Exhibit 8: Summary Statistics: Dollar-Cost Averaging, 100% Lump-Sum Investment, and Scaled Lump Sum
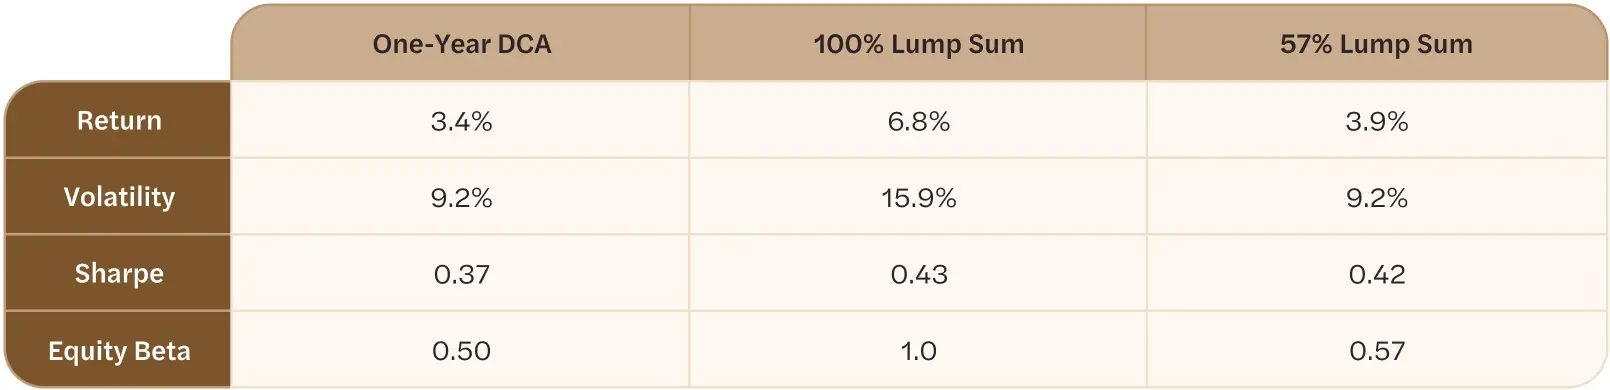
Exhibit 8 repeats Exhibit 3, adding a column for the scaled lump-sum strategy. By design, the volatility of the 57% lump-sum investment matches that of the one-year DCA. However, as previously discussed, the returns – and therefore Sharpe – are higher for the lump sum, driven by its higher exposure to the equity markets (57% upfront, reflected also in the Equity Beta, versus 50% on average throughout the year). Relative to the 100% lump sum, the scaled lump sum has a slightly lower Sharpe (0.42 versus 0.43), driven by a modest time-varying exposure to equities (since the upfront investment is made once, with no rebalancing). In sum, the scaled lump sum results highlight the benefits of being invested upfront: given its time diversification, it can achieve a much higher return for the same level of risk as the DCA strategy.
Dollar-Cost Averaging and Sequence of Return Risk
By design, the DCA and our scaled-upfront portfolio have equal volatility. How sensitive are the two strategies to the sequence of returns?
We use the numbers from our example before: a $252,000 initial wealth that is either 57% invested upfront ($143,640, with the remainder held in cash) or invested in a DCA strategy ($1,000 per day, with the remainder held in cash). Cash is assumed to yield zero returns. We use a 252-day sample of returns that is representative of our starting assumptions (7% annualized return and 16% volatility). Using that sample of returns, we scramble the ordering of the returns throughout the year and run 10,000 samples of end wealth outcomes.
Exhibit 9: End Wealth After One Year of 7% Annualized Returns
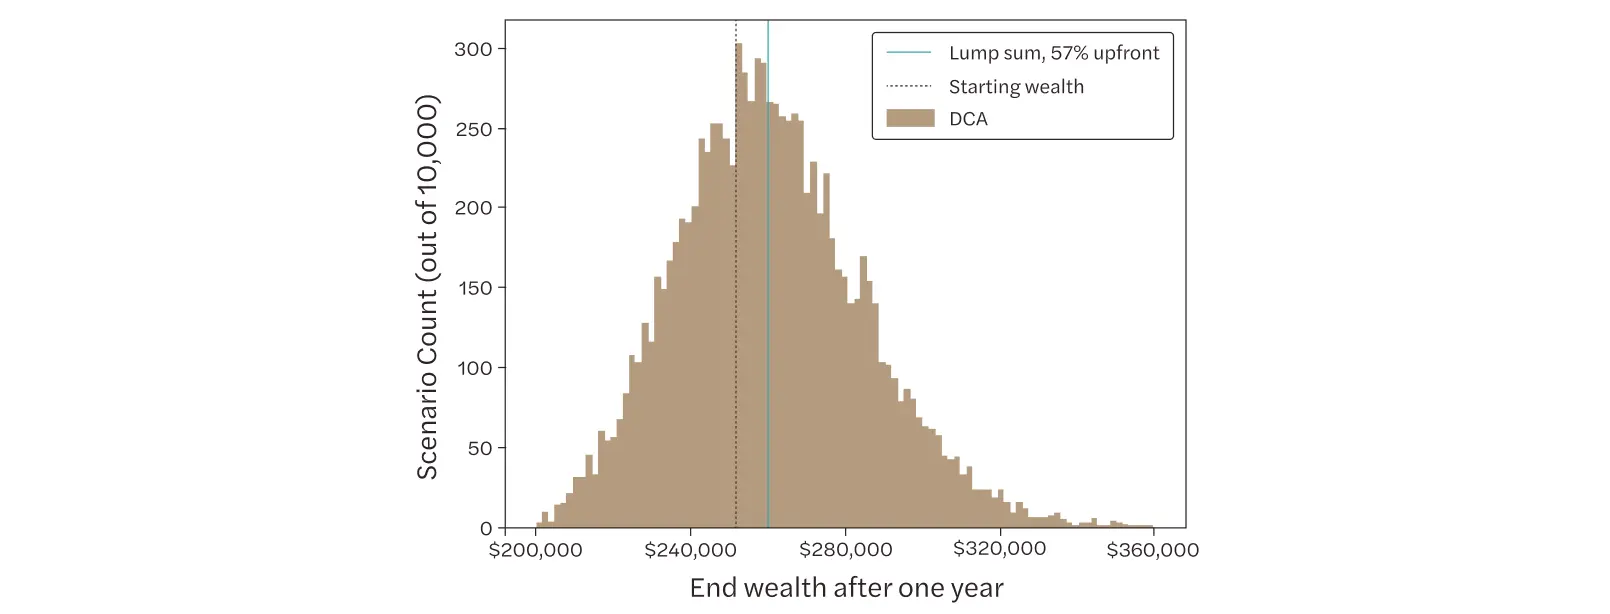
Exhibit 9 shows the end wealth distribution of the two strategies. The lump sum investment results in the same end wealth in each scenario: regardless of path, the return sequence is simply scrambled in each scenario, and therefore results in the same aggregate result. The DCA strategy, in contrast, has a large dispersion of end wealth, with the 5/95th interval spanning over $80,000. The DCA strategy also exposes the investor to potential losses relative to their initial deposit, with 37% of scenarios resulting in a lower-end wealth than the initial deposit after one year. These losses are despite the fact that the exercise chose a series of returns that has realized precisely a 7% return over the year. The DCA strategy augments sequence of return risk dramatically.
Typically, in line with the uncertainty equivalence concept, a rational investor could only justify such a material difference in outcome distributions if it were accompanied by a higher expected return to the more uncertain strategy. However, in this case, the lump sum investment has both a narrower distribution and a higher expected end wealth. Upfront investing is more robust to sequence of return risk than DCA.
Summary
The regret of investing a large amount at a market high can feel worrisome for many investors, and DCA can be a tool to help establish market exposure over time. But for investors who can tolerate a small likelihood of regret for a better expected outcome, DCA is a more expensive tool in comparison to simply investing upfront.
There’s also a high likelihood that DCA could lead the investor to be worse off, and in a meaningful way – approximately 3-5% of lost-end wealth. Even controlling for the lower risk assumed (i.e. scaling the upfront amount to be smaller in order to match the DCA strategy’s portfolio volatility) the upfront lump sum is expected to perform better. Moreover, upfront investing can provide more protection to sequence of return risk.
To a sophisticated analyst, these results may seem obvious. In our first exercise, the market exposure of (100% upfront) lump sum investing was higher than the DCA comparison, so it is not surprising that it tended to outperform given generally rising markets. Our second exercise – scaling the upfront investment to 57% to have comparable volatility to DCA – demonstrated the benefits of time diversification of market exposure. The upfront investment was able to be larger than the 50% weight (the average DCA exposure) and achieve the same volatility due to time diversification of market exposure, and in doing so, also yielded higher expected returns. Along similar lines, we demonstrated that the upfront investment is much more robust to sequence of returns risk, a corollary to the time-diversification benefit of investing upfront.
What does this mean for the average retail investor? We recognize the behavioral arguments for DCA, which often allude to being able to “stay the course” even during volatile markets. There’s no statistical model to justify, or refute, that some investors may need to gradually dip their toes into the waters to get comfortable. However, for those investors who are sitting on the sidelines hoping to benefit from dollar-cost averaging their cost basis, we would argue that the evidence is strongly against the existence of those benefits. Investors are typically best-off investing all at once.
References
Rozeff, Michael S., Lump-Sum Investing Versus Dollar-Averaging. Journal of Portfolio Management, pp. 45-50, Winter 1994. Available at SSRN.
Footnotes
-
Many investors work with a financial advisor to assist with retirement planning and overall investment decisions. These investment advisors can develop an overall investment plan, which would take into consideration which asset classes are appropriate for long-term investing in consideration of the investor’s risk tolerance. ↩
-
See The Pros and Cons of Dollar-Cost Averaging by FINRA. ↩
-
We model the asset price using Geometric Brownian Motion and allow for autocorrelation between daily returns. We assume a mean annualized return of 7% and an annualized volatility of 16%. We run 10,000 scenarios. We focus on the end wealth of the investor at the end of the period. Over longer horizons in which the investments are allowed to continue growing, the end wealth results would be directionally consistent and even larger. ↩
-
In reality, most DCA rules would have periodic investments – i.e. monthly rebalance – so if anything, our results should favor DCA since we further smooth out potential market movements, and we assume transaction costs are zero for this exercise. ↩
-
The scaled upfront investment assumes a fraction of wealth is invested upfront and no subsequent rebalancing. For instance, if an investor starts with $100, a 60% upfront investment would allow him to buy $60 of equities. If, in the next period, the equities were worth $70, he would stay invested in the $70 rather than rebalancing to maintain a 60% allocation.
A similar exercise could be run where the scaled investment was assumed to be rebalanced back to the initial allocation each period. This, in fact, reduces timing risk even further as the portfolio is equally exposed to return volatility over time, while the scaled upfront version allows the portfolio weights (and therefore exposure to asset risk) to drift over time. The scaled-rebalanced investment could likely assume a slightly greater allocation than the scaled-upfront and achieve the same portfolio volatility. We believe the scaled-upfront provides a more intuitive strategy to the average investor, and proceed with it here. ↩
-
This analysis neglects the potential interest return of cash. The scaled investment would earn the cash interest rate on the uninvested 43% of the wealth. The DCA strategy would start with nearly 100% of its portfolio in cash and gradually transition out, averaging 50% cash weight in the portfolio across the year. The net effect of the cash interest rate depends heavily on assumption. On one hand, the higher average cash weight for the DCA strategy might mean the inclusion of cash interest should make DCA more favorable. On the other hand, interest yields on 1-year instruments (such as a 52-week Treasury Bill) is likely to be higher than a savings account, which may be required to provide the liquidity needed to invest gradually in the DCA strategy. On net, the effect of the cash interest rate is likely to be slightly favorable toward the lump-sum investment.
The mean investment for the DCA is actually slightly higher than 50% since the average return on the asset is positive, while the return on cash is zero by assumption. ↩