In a recent article titled “How Many Stocks Should You Own?”, we argue that contrary to conventional wisdom, a portfolio of 20-30 stocks is insufficiently diversified. A long-term investor with so few holdings may suffer large shortfalls in terminal wealth relative to their highly diversified counterpart. We support our position with the results of historical backtests: for each n ≥ 10, we construct 5,000 portfolios over a 25-year period, each consisting of n randomly selected stocks. At the end of the investment period, portfolios with 20-30 stocks exhibit a very broad range of terminal wealth, which clearly indicates the need for greater diversification.1
By a wide margin, the number one comment, question, or dismissal of our findings is related to the lack of sector controls in our randomization methods. It makes intuitive sense: without sector diversification, a portfolio might end up with stocks concentrated in a couple of sectors. Hence the wide distribution of terminal wealth we see in portfolios might be attributable to the volatility from sector bets.
After all, sectors are an important risk factor in asset allocation, and no sophisticated investor would ignore controlling such an exposure.2 Hence a sector-controlled low-name portfolio should surely exhibit significantly improved diversification characteristics relative to our naïve uncontrolled methods, right?
Nope.
We find that, if someone chooses to hold only a few dozen names, careful sector controls do not offer enough diversification benefits to save them from bad luck. It helps, a little. But it is no substitute for owning more names.
To be clear, we’re not claiming that sector risk is unimportant. However, for low-name portfolios, stock-specific risk is much higher and dominates sector risk. A portfolio that has insufficiently diversified stock-specific risk can realize greater diversification benefits by adding just a few more names in their allocation than by controlling its sector exposures.
To test the impact of sector controls, we extend the portfolio construction and rebalance process of How Many Stocks Should You Own? to include portfolios with an equal number of stocks from each sector.3 Our sector definition comes from the Global Industry Classification Standard (GICS) developed by S&P Dow Jones Indices and MSCI.4 Moreover, when a stock in the portfolio is delisted before the end of the investment period, we replace it with another randomly selected stock from the same sector at the end of the month of its delisting.5 At the end of the investment period, we calculate the portfolio Terminal Wealth Multiple (TWM) using monthly investment returns, which include both price movements and dividend payments. To measure the magnitude of unlucky outcomes, we plot the 10th percentile loss in TWM for portfolios with n=20,40,60,…,180,200 stocks relative to the expected TWM of a fully diversified portfolio. Under the hypothesis of our skeptics, sector controls should materially reduce the potential shortfalls of under-diversified portfolios.
Figure 1: 10th Percentile Portfolio Terminal Wealth Relative to Average Outcome

Source: NDVR, Center for Research in Security Prices, S&P Global
Figure 1 compares the 10th percentile underperformance between sector-controlled investment portfolios and randomly generated portfolios. Consistent with theories of risk management, sector-controlled portfolios indeed have smaller potential losses relative to their randomly generated counterparts. However, the magnitude is far smaller than what many financial advisors seem to suggest in their recommendations. The marginal improvement certainly does not change our conclusion in How Many Stocks Should You Own? paper.
With 10th percentile bad luck, a sector-controlled portfolio with 20 stocks underperforms the broad stock market by 37%, compared to 42% underperformance for the naïve random portfolio. That’s hardly any comfort to long-term investors who seek to diversify their stock portfolios to reduce the downside risk in terminal wealth. In addition to the narrow gap between the two curves, another important takeaway is that the two curves are essentially the same in shape: not only are 20-30 names not enough for sector-controlled portfolios, but investors can also significantly reduce the impact of negative outcomes by holding more names in their sector-controlled portfolios.
To generalize the effect of sector risk beyond unlucky events, we use the standard deviation of the TWM distribution normalized by its mean to capture the variation across simulations. It shows the extent of variability relative to the average outcome and is often referred to as the Coefficient of Variation (CV). A large CV indicates that the simulations have a wide range of outcomes, putting investors’ realized TWM at high risk. Figure 2 shows the CVs of uncontrolled and sector-controlled portfolios of sizes between 20 and 200. After controlling for sectors, TWMs are indeed closer to each other for all sizes, but the diversification benefit is minor compared to the overall variation, especially for smaller portfolios. A portfolio with 20 names only shrinks the variation from 35% to 31%.
One might argue that any reduction is beneficial; hence, a retail investor with 20 stocks in the portfolio should still try to diversify sector exposures. Fine. But it is a mistake to believe the benefits of holding hundreds of names can be achieved instead by holding a carefully sector-controlled low-name portfolio. When the number of stocks in the portfolio is low, reduction in CV along the x-axis by adding more stocks is much more drastic than by introducing sector controls as shown by the gap between the two curves.
We are not downplaying the importance of sector-level risk, which plays a vital role in quantitative investment. As the above figure shows, once a portfolio reaches a couple of hundred names, the line of CV becomes so flat that adding more names barely moves the needle at all. What’s left in the portfolio manager’s repertoire is controlling sector-level risk. At that point not only is it necessary but also impactful: at 200 names, sector-stratification reduces CV from 10% to 8%, a 20% improvement in risk management! But for a retail investor who seeks to reduce the risk of an under-diversified portfolio, sector-controlling doesn’t quite cut it.
Figure 2: CV of TWM for Uncontrolled and Sector-controlled Portfolios

Source: NDVR, Center for Research in Security Prices, S&P Global
To better understand the relationship between uncontrolled and sector-controlled portfolios, we plot in Figure 3 the CV-equivalent number of names held in the two types of portfolios. The x-axis represents the number of names in a sector-controlled portfolio and the y-axis represents the extra number of names that are required in the uncontrolled portfolio to achieve the same CV. It offers some guidance in evaluating the effectiveness of the two methods under portfolios with various sizes.
Two findings emerge. First, for lowly diversified portfolios, only a few additional names are needed to achieve the same effect as controlling sector exposures. For a portfolio with 20 stocks, the improvement from sector controlling is equivalent to adding merely four more stocks to the uncontrolled portfolio. Again, the intuition is that the portfolio has so much undiversified stock-specific risk, it is much more efficient to reduce stock-specific risk by holding more stocks than to control sector risk. Second, once a portfolio is highly diversified and stock-specific risk has been materially reduced, adding more names becomes much less effective as a method of diversification. As the portfolio size increases to 200, the investor must add 70 additional stocks to achieve the same level of risk reduction as provided by sector control.
Figure 3: CV-equivalent Number of Additional Stocks Needed for Uncontrolled Portfolios

Source: NDVR, Center for Research in Security Prices, S&P Global
So far, we have demonstrated that sector control does not effectively reduce risk in an under-diversified portfolio. This may come as a surprise to many investors because different sectors clearly do not have the same expected or similar realized returns. In the past year (as of January 25, 2023) the most profitable sector, Energy, gained 44.3% while Communication Services tanked 26.7%. One might think one-year data is just noise and over time the laggards will catch up. But the differentiation is even greater at longer horizons. In the past decade, Information Technology has quadrupled while the Communication Services and Energy sectors have barely grown at all!6 While past performance is not indicative of future results, it clearly highlights the distinction across sectors. There are many investment products, such as Exchange-Traded Funds (ETFs), index funds, and mutual funds that give investors exposure to individual sectors.
Based on these results, it is tempting to conclude that controlling for sectors in a randomly selected stock portfolio matters a great deal in narrowing down the expected returns of a portfolio. However, this is not the complete picture. Just because Information Technology had higher average returns than other sectors, it does not imply that a randomly chosen stock in the sector also had higher returns than a randomly chosen stock for another sector. In fact, it is well-known that the Information Technology sector has the largest within-sector dispersion, even after excluding mid-caps and small-caps.7
The gap between two stocks from the sector may be as large as the gap between stocks from different sectors. Bessembinder (2018) takes it even further and shows that the distribution of individual stock returns is so skewed that the positive returns of the entire stock market are driven by merely 4% of all listed companies in history. In other words, what seems to matter more for an investment strategy is not whether a portfolio has the right sector exposure, but whether it has the right stocks.
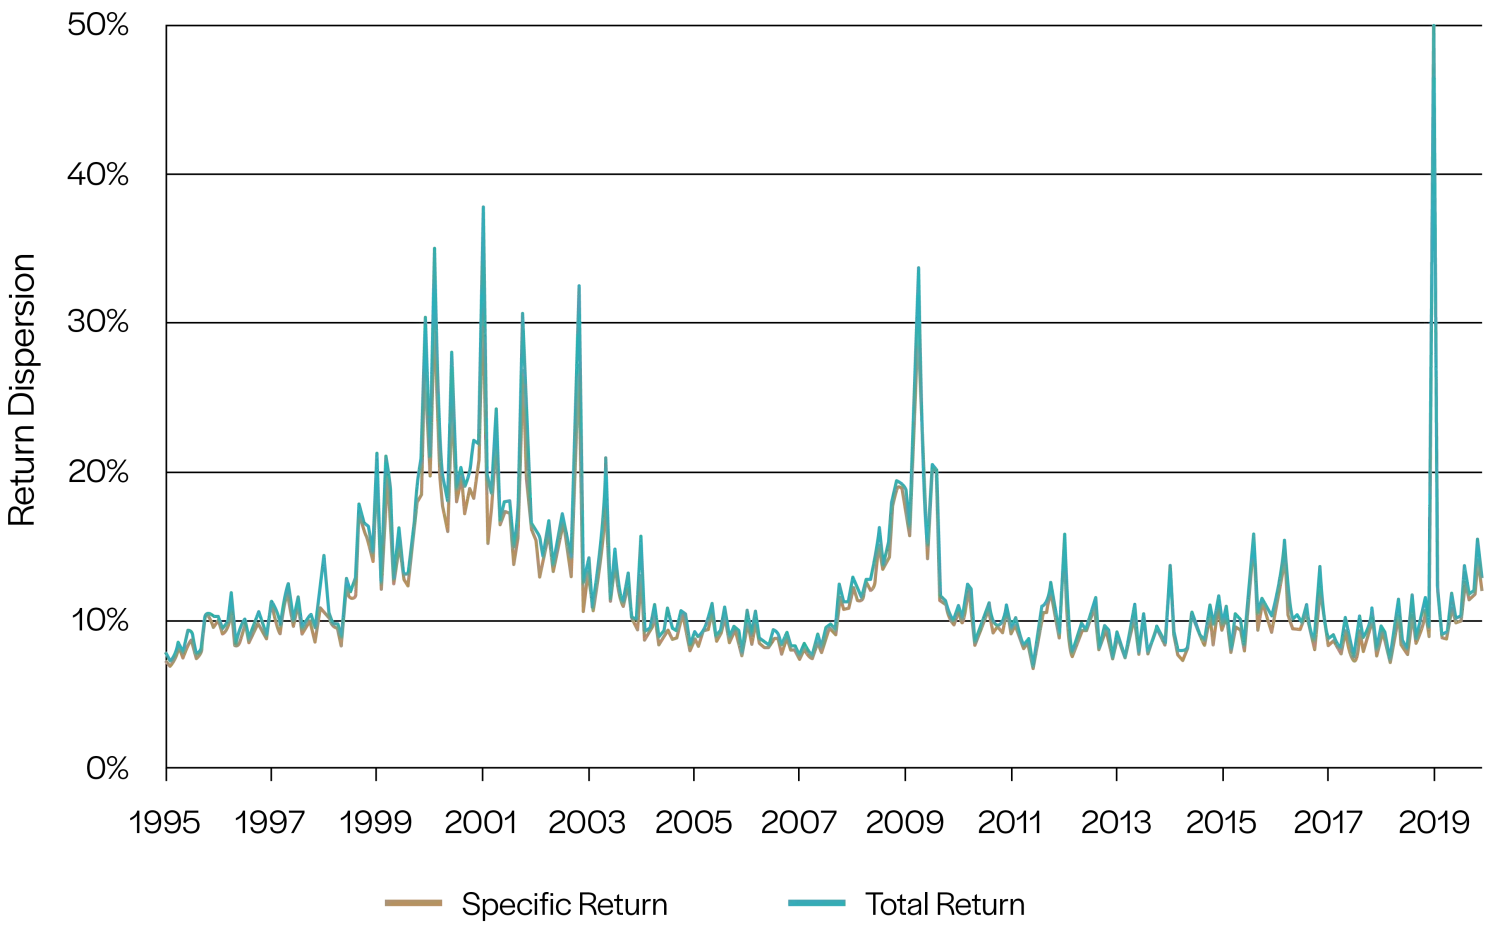
To measure how much sector variation matters in explaining stock return dispersions, each month we remove sector average returns from stock returns and replace them with the market average. This ensures that the overall average is unchanged, and all sectors now have the same average returns as the market. Hence any remaining dispersion should only come from the stock-specific component. The comparison of dispersions using total returns and stock-specific returns can inform us of the potential benefit of sector control: if sector classification explains all the variation, then controlling sector exposure effectively controls the overall portfolio return. On the other hand, if most of the variation comes from the stock-specific component, controlling sectors will have little impact on the final portfolio.
Empirical data seems to suggest the latter: as shown in Figure 4, with or without sector variation, the two dispersion series are very close to each other. Removing sector average returns has very little impact on return dispersion. On average, the stock-specific component accounts for 91% of the overall dispersion over the sample period.8
Figure 4: Monthly Return Dispersions Using Total Returns and Stock-Specific Returns
Source: NDVR, Center for Research in Security Prices, S&P Global
Finally, as a thought experiment, we plot the CVs of randomly simulated portfolios using stock-specific returns instead of total returns for illustrative purposes. If sector-level differences are the main driving force of the return variation across uncontrolled portfolios, we should expect to see a significant reduction in CVs since all sectors have the same average returns now. However, as Figure 5 shows, the difference is very marginal. Removing sector-level average returns brings down the CV of a 20-stock portfolio from 35% to 32%, or about 9% of the total variation. Hence it is not surprising that sector control does not significantly reduce the risk of small portfolios since most of the randomness comes from the stock-specific component.
Figure 5: CV of TWM for Uncontrolled Portfolios Using Total Returns and Stock-Specific Returns

Source: NDVR, Center for Research in Security Prices, S&P Global
So… do sector controls reduce portfolio risk? Yes. Do they save under-diversified portfolios from large potential relative shortfalls? No. Our findings illustrate that most of the risk in under-diversified portfolios comes from stock-specific components, which can only be diversified away by holding more names. Hence our conclusion in How Many Stocks Should You Own? still holds: investors would generally benefit from owning more than 20-30 stocks, even if they are sector diversified.
Disclosure
Yin Chen is a Vice President of Research at NDVR, Inc. E-mail: yin.chen@ndvr.com. Roni Israelov is President and Chief Investment Officer at NDVR, Inc. E-mail: roni.israelov@ndvr.com.
This material is published for informational purposes only.
The views expressed and other information included are as of the date indicated and based on the data available at that time. They may change based on changes in markets, general economic conditions, rules and regulations, and other factors. NDVR does not assume any duty to update any of the views and information herein. Unless otherwise noted, views and opinions expressed are those of the authors and not necessarily those of NDVR or its affiliates.
NDVR is an investment advisor that may or may not apply the views and other information described herein when providing services to its clients. The views and information herein are not and may not be relied on in any manner as, investment, legal, tax, accounting or other advice provided by NDVR to any individual or entity or as an offer to sell or a solicitation of an offer to buy any security.
Footnotes
-
For more discussion of its implication for stock market investors, we refer the readers to the Bloomberg article reporting on our findings. ↩
-
Our findings should extend to other asset classes such as bonds. Investors who allocate to fixed income instruments, such as high-yield corporate bonds have similar diversification considerations. Holding a sector-diversified corporate bond portfolio with too few issuers may not sufficiently reduce the risk of loss of principal. ↩
-
There are at least two definitions of sector diversification: 1. Equal number of stocks from each sector or 2. Same proportion from each sector as the broad stock market, such as the S&P 500 index. We use the first definition in our analysis because the market itself is not only highly skewed in sector distribution but also exhibits high variation across time, resulting in excessive market volatility. Hence forcing equal number of stocks per sector is a more rigid control that can give us an upper bound for the impact of sector diversification on portfolio risk. ↩
-
For robustness checks we also used the Fama-French 10 Industry Classifications (plus an additional industry for stocks not covered in their scheme) and found similar results. ↩
-
Currently the 11 GICS Sectors are: Energy, Materials, Industrials, Consumer Discretionary, Consumer Staples, Health Care, Financials, Information Technology, Communication Services /Telecommunications, Utilities, Real Estate. Since the Real Estate sector, which mostly consist of REITs, was originally under the Financials until 2016, in our exercise we treat them as the same sector, which gives us 10 sectors in total. A sector-controlled portfolio with n x 10 stocks has n stocks from each sector. ↩
-
Instead of contemporaneous return dispersions, Campbell, et al. (2002, 2022) decompose the volatility of individual stocks at the market, industry and firm levels. They show that even with 50 industries (more granular than our Sector classification), the lion’s share of the total risk decomposition is still the firm-level variance, which accounts for around 60% of return variability. Industry variance comes dead last, even below the overall market component. ↩