Introduction
Whether back- or front-of-mind, tail risk is usually an important consideration for investors. Most understand that expected investment gains are coupled with the risk of loss, but loss and catastrophic loss are not one and the same. The desire to limit catastrophic loss risk has led to a sizable investment subspace focused on tail protection strategies, which primarily employ convex derivatives.
The efficacy of protection strategies is either praised or called into question, with the perspective seemingly influenced by the nature of the last crisis. Figlewski et al. (1993) investigates protective put options via simulation and Israelov (2019) investigates one specific set of tail protection strategies (buying monthly 5% out-of-the-money S&P 500 put options, which mimics the Cboe S&P 500 5% OTM Put Protection Index), and both papers show that buying downside protection options is likely to hurt the downside risk profile for long-term investors.
The nature of each tail event can be unique, and the tail protection profile provided by different convex instruments, or the same convex instruments used differently, is similarly unique. The actual protection they provide from specific tail events can be even more varied due to path dependent outcomes. Sometimes, a given strategy can mitigate a tail event with near-perfect precision. Other times, protection may do little or make things worse. Risk-conscious investors face important decisions on if and how to include tail-risk-mitigating strategies in their portfolios.
For those who are concerned about tail risk, the past few years have been enlightening. At the outset of the COVID pandemic in early 2020, equities saw a significant spike in volatility that coincided with a notable crash in equity values. The nature of the crash was nearly textbook in terms of how many investors visualize tail events. After the crash event, equity values quickly recovered and then rallied through the end of 2021 achieving all-time highs, not only in terms of prices but also in terms of valuations. The following year (2022) was one of reversal, with equity index values declining slowly, yet consistently, realizing a peak-to-trough drawdown of nearly 25% with significant destruction of wealth. A slow, yet economically material “crash.”
This paper serves as a retrospective of these events, analyzing the behavior of several tail-risk mitigating strategies across four distinct periods. The first period is an extended historical sample ending December 2019 to provide context for the other three recent periods. The second period is the COVID Crash beginning on December 31, 2019, and ending at the equity trough on March 23, 2020. The third period is the Post-COVID Recovery and rally beginning March 23, 2020, and ending December 31, 2021. The final period is the slow grind down that occurred in 2022, beginning December 31, 2021 and ending November 30, 2022.
It would be impossible to provide an exhaustive analysis of tail-risk mitigation strategies as there are endless potential strategies and variations of strategies that can be implemented.1 We analyze three flavors of tail-risk mitigating strategies that hopefully provide some perspective. We begin with a long-volatility strategy that purchases monthly straddles and strangles and delta-hedges the option positions to isolate the long volatility exposure and neutralize equity beta. Next, we consider the strategy underlying the Cboe S&P 500 5% OTM Put Protection Index, which purchases monthly modestly out-of-the-money put options to protect against significant short-term crashes. Finally, we investigate the properties of a long VIX futures hedge.
All three strategies are long volatility, but the strategies are not necessarily substitutes for one other. Buying put options in a put protection strategy incorporates long volatility alongside negative equity beta, so the put overlay provides delta, gamma, and vega. Furthermore, the magnitude of the equity beta increases as equity markets decline, until the option expires and the equity beta is reset. In fact, a significant component of the returns of the put protection strategy is attributable to this variable equity beta, which could potentially be implemented with a dynamic equity trading strategy that holds no options whatsoever. Delta-hedged long option positions intentionally remove (hedge) this component to isolate the options’ convexity, so the strategy provides gamma and vega, but no delta. VIX futures are different from equity index options in that they have no mechanical exposure to S&P 500 returns (linear or non-linear). They have exposure to S&P 500 Index implied forward volatility, so the strategy is long vega (but a different vega than with delta-hedged index options) but has no delta or gamma.2
Some proponents of long volatility tail hedges unsurprisingly suggest that their proprietary implementations are uniquely optimized to provide attractive tail hedges without the unattractive negative carry. Others recognize the variability in exposures and hedging characteristics and suggest instead an ensemble approach. While the outcomes of the three styles of hedges we investigate are not sufficiently strong for their implementers to take victory laps, the variability in outcomes is high enough to suggest an ensemble approach might be warranted for those who are interested in implementing such protective measures.
Our article proceeds as follows. We begin by describing my source data and methods. We follow by describing each strategy, in turn, across the four periods described above. Finally, we conclude.
Data and Methods
Data
S&P 500 Index options data is sourced from iVolatility and covers the period beginning December 17, 1992, through December 30, 2022, and mid-point option prices are calculated as the average of reported bid and ask prices. VIX Futures is from Chicago Mercantile Exchange beginning January 2, 2008, through December 30, 2022. The Cboe S&P 500 5% OTM Put Protection Index is from the Chicago Board Options Exchange from January 5, 1988, through December 30, 2022. Risk-free rates data consists of the 30-day Treasury bill returns from the French Data Library from January 1926 to July 2001, and the 1-month Constant-Maturity return from Reuters, from July 2001 to December 30, 2022. Delta-hedges are computed using deltas reported from iVolatility and applied to the S&P 500 Total Return Index from Reuters. The S&P 500 Price Index is also from Reuters.
Methods: Long Volatility Index
The long volatility index is constructed using a similar methodology applied in Israelov and Kelly (2017) and Israelov and Tummala (2017) and Israelov and Tummala (2020). The portfolio is comprised of four S&P 500 Index options:
- at-the-money call option with strike KcallATM
- at-the-money put option with strike KputATM
- out-of-the-money call option with strike Kcall0.25
- out-of-the-money put option with strike Kput-0.25
The at-the-money strike KATM realizes the minimum absolute delta of the straddle portfolio, while the out-of-the-money options achieve individually approximately 0.25 absolute delta. The strategy purchases options with one month until expiration (traditional third Friday expiries) and holds them until the day before the expiration when the next portfolio of options is purchased.
One-third weight is given to each out-of-the-money option (Kcall0.25 and Kput-0.25) and one-sixth weight is given to each at-the-money option (KcallATM and KputATM). This weighting scheme equally weights the three selected strikes and through the lens of put-call parity is agnostic to whether the option at the given strike is a put or a call. As suggested by the papers referenced above, the portfolio is capitalized with cash equal to the S&P 500 Price Index level such that the magnitude of long volatility returns over time is invariant to the index level.
I calculate the unhedged long volatility option excess return, which may be decomposed into excess returns associated with option delta and delta-hedged option returns as follows using the method proscribed by Israelov and Nielsen (2015a):

In this case, the option prices represented by Popt,t and the option deltas represented by Δopt,t are the weighted average prices and deltas across the four individual option contracts as described above. Δopt,t−1 represents the previous day weighted average option delta at the close of the previous day, after the roll, if applied.
Methods: Put Protection Index
The Cboe S&P 500 5% OTM Put Protection Index is constructed by the Chicago Board Options Exchange. We compare its properties directly against those of the S&P 500 Total Return Index. In addition, we also consider the decomposition suggested by Israelov and Nielsen (2015a) to better understand the drivers of performance. Like the approach detailed above for the long volatility portfolio, except extended to incorporate the static average negative equity exposure provided by long put options, we decompose the returns of the put protection index into four components: the pure S&P 500 index, passive equity hedge (or passive), equity timing due to dynamic delta, and delta-neutral (or hedged) returns:

where

With –ΔPUT the full sample average of the put option delta and the leverage-adjusted delta:

The adjusted delta incorporates two effects. The first effect is the option’s time-varying equity exposure, directly captured by its delta (Δopt, t−1). The second effect is the reduced dollar allocation to the S&P 500 Index arising from the capital allocation to the put option.
To perform the decomposition, we reconstruct the put protection index returns using the underlying options data provided by iVolatility. Our analysis of the Cboe S&P 500 5% OTM Put Protection Index begins January 5, 1988 and our decomposed reconstructed series begins January 14, 1993.
Methods: Long VIX Futures
For the long VIX Futures strategy, we abstract away from sizing decisions. We report the profit and loss in volatility points for a strategy that buys a single contract. With a futures multiplier of $1000 applied, the interpretation of the results is the dollar PL associated with owning a single contract. Any hedger can scale up or down the position as desired to achieve a targeted amount of hedging.
We consider a long VIX futures strategy that generally seeks to own the nearest tenor. The strategy consists of a long position in one VIX futures contract that is rolled to the next monthly contract seven calendar days before its expiration.
Results
Results: Long Volatility with Options
A portfolio of long option positions is typically referred to as being long volatility. Because long option positions have positive gamma and positive vega, such a portfolio is generally expected to profit when realized or implied volatility spikes, respectively, hence the long volatility moniker. Periods of market stress (declines) are often coupled with spikes in volatility and therefore long option positions are generally viewed as a convex hedge that should provide significant protection during quick equity drawdowns due to heightened volatility.
Long volatility strategies face a headwind, though. Option prices tend to incorporate a volatility risk premium, which creates a drag on performance.3 Equity index options tend to be somewhat expensive and carry negatively. When realized volatility meets its expectations, long volatility positions are expected to lose money – a modest spike in volatility is required just to break even. This specific characteristic of long volatility positions is analyzed in depth by Israelov and Tummala (2020).
Arguably, delta-hedged options provide purer exposure to convexity. Delta-hedging isolates exposures to realized (gamma) and implied (vega) volatility while neutralizing affine market exposure. Investors can relatively easily hedge affine market exposure using futures contracts or by partially liquidating their equity positions – options are not required to implement such a linear hedge, but convex derivatives are required to hedge volatility risk.
With this context, we now consider the performance of long volatility positions using equity index options. Figure 1 plots its performance over the four periods of interest in the top panel and reports summary statistics in the bottom panel.
Figure 1: Long Volatility Performance
This figure reports historical long volatility performance as represented by a portfolio of delta-hedged S&P 500 Index options. The Delta-Hedged series represents a long options portfolio that is fully delta-hedged each day. Its performance is decomposed into an Unhedged and a Delta-Hedging series. The Delta-Hedging series corresponds to the excess returns generated by the delta-hedging positions. The top panel plots cumulative arithmetic returns to each series across the following four periods: Pre-COVID, COVID Crash, Post-COVID Recovery, and the 2022 Bear Market. The lower panel reports summary statistics for the three series across the same four periods.
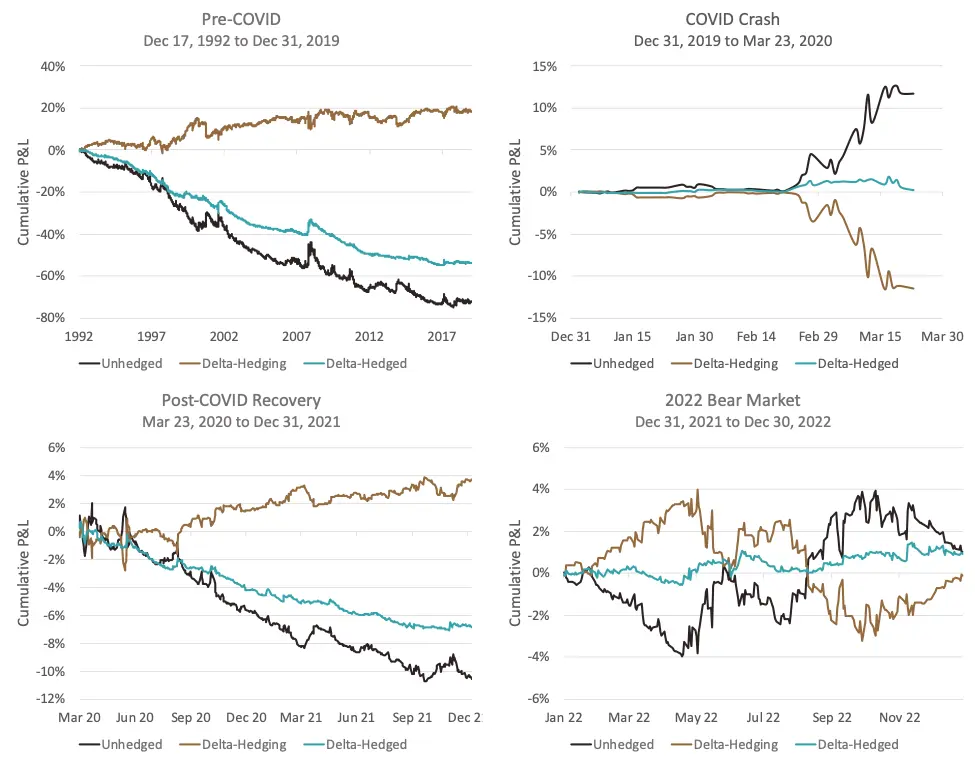
Source: NDVR, iVolatility, Reuters, French Data Library
We see clear evidence of the volatility risk premium during the extended Pre-COVID period. The delta-hedged option positions realized a -0.87 Sharpe ratio with -2.2% annualized excess returns on 2.5% annualized volatility. Delta-hedging effectively reduced the risk of unhedged positions, isolating the convexity exposures. Unhedged long option positions had nearly twice the volatility of the delta-hedged positions. Over this sample, delta-hedging hurt annual returns to the strategy by about 0.5% annualized. The average option delta over this period was -0.08, so the delta hedge on average had a 0.08 exposure to the S&P 500 Index. Thus, positive performance for the delta hedge is expected and, in fact, the alpha was -0.3% (not statistically significant).
Let’s now consider the COVID crash period beginning in January through March 23 of 2020. We have a remarkable tale of two hedges. The hedging strategy designed to isolate convexity exposure by delta-hedging lost money during this period and was down 1.9%. Meanwhile, its unhedged counterpart realized gains of 11.7%. Delta hedging (buying as the market fell) hurt performance by 13.6%.
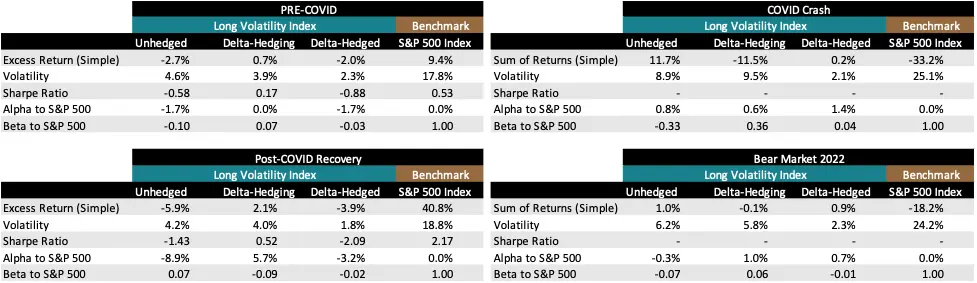
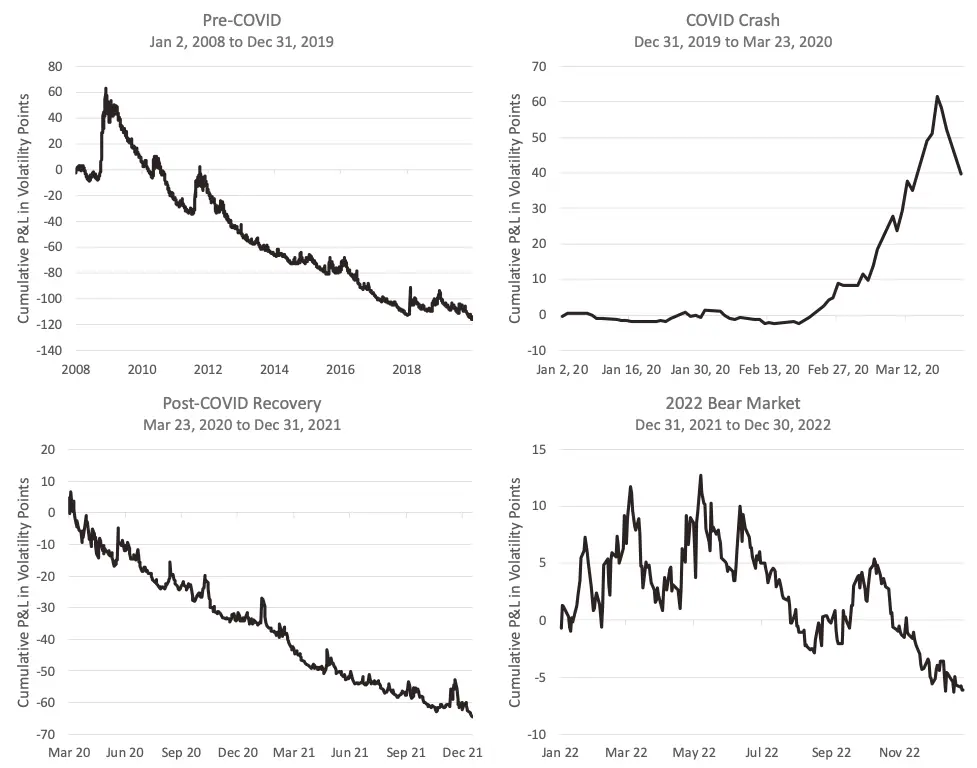
There are two primary explanations for such a result. First, trending markets benefit unhedged long option positions and hurt unhedged short option positions. Delta-hedging neutralizes these exposures to trend. The COVID crash was a period of downtrend that benefited unhedged long option positions. Second, when markets trend away from option strikes, the options’ convexity starts to disappear. During the COVID cash, the market trended away from the option strikes and the long option positions had little convexity remaining to benefit from the realized volatility spike. Figure 2 plots the S&P 500 Price Index-adjusted vega and gamma respectively during the period of the COVID crash. Path-dependent exposures have the potential to hurt hedging efficacy. An option strategy would need to continually rebalance positions to maintain consistent convex exposure as the market moves.
Figure 2: Long Volatility Convexity Exposures during COVID Crash
The figures report the daily aggregated normalized vega and gamma of a long volatility portfolio using monthly-rebalanced S&P 500 Index options during the COVID Crash period. The aggregated normalized vega is defined as the weighted average vega divided by the S&P 500 Index price observed during the previous roll date. The aggregated normalized gamma is defined as the weighted average gamma multiplied by the S&P 500 Index price observed during the previous roll date.
Source: NDVR, iVolatility, Reuters
The Post-COVID Recovery period was a tough time for long volatility positions as option markets reflected a heightened volatility risk premium. During this period, delta-hedged long option positions realized a -1.95 Sharpe ratio, with nearly double the annualized losses (-4.1%) of the historical period, despite having lower realized volatility. Capital allocated to volatility selling strategies was diminished after many of these strategies realized catastrophic losses during the COVID crash.4 Lack of supply had an impact.
Through this period, those implementing delta-hedged long option hedges must have been disappointed. Over a period spanning more than two decades, the annualized hedging carry was negative. During the COVID Crash, the strategy lost money at 4x the typical annualized pace. And then during the Post-COVID Recovery, the strategy lost money at 2x the typical annualized pace. For those who continued to implement the strategy, the drawdown of 2022 finally brought some relief with a 0.9% positive performance. Delta-hedging was nearly inconsequential in 2022 and the unhedged strategy realized 1.0% returns over the same period. We also see from Figure 1 that during most of equity’s drawdown in 2022, the delta-hedged strategy was either flat or down. Its modest positive performance only picked up towards the end of the year.
The magnitude of these numbers suggests that it’s difficult to make the economics of the hedging strategy work. Even during 2022 when the strategy achieved its hedging goal, a 1.5% return is modest when compared against a 20+% equity drawdown. Arguably one who would seek a hedge that moves the dial would need to apply some or considerable leverage to the option positions, in which case their poor performance during other periods would have done more damage.
Results: Put Protection
The idea behind put protection strategies is straightforward. Buy an equity index put option to protect against drawdowns beyond the option strike selected. As Israelov (2019) shows, outcomes for put protection strategies are anything but straightforward. Path dependence and option expensiveness due to the volatility risk premium can potentially wreak havoc when implementing the put protection hedge.
There are three important components to a put protection hedge. First, buying a put option introduces negative equity exposure (a hedge). We can decompose this hedge into a static reduction in equity exposure and a dynamic equity exposure that evolves around the static reduction. A static reduction in equity exposure reduces expected returns due to lower captured equity risk premium. The dynamic change in equity exposure arguably has no expected return, but should contribute positively in a trending environment and negatively in a mean-reverting environment. Although buying a put option provides both exposures, an option is not required to capture either property. A hedger could simply trade S&P 500 Index futures to introduce a comparable hedge. The third exposure introduced when buying a put option is long convexity (gamma and vega), which is like the exposures provided in the delta-hedged long volatility positions explored earlier.5
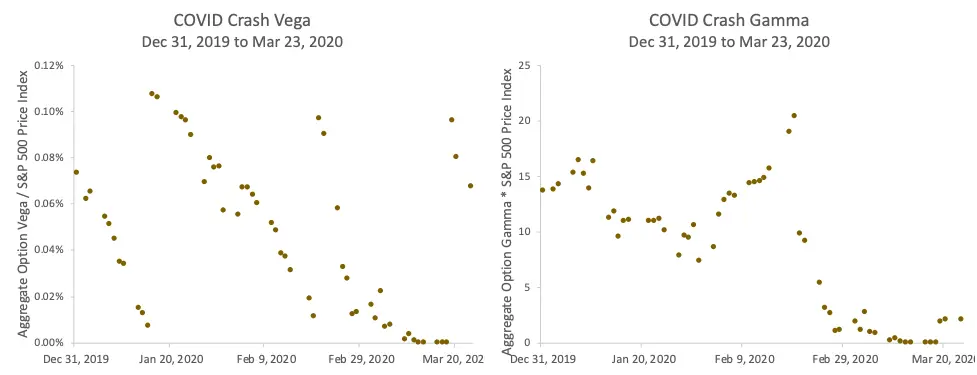
Figure 3 plots and reports the performance of the Cboe S&P 500 5% OTM Put Protection Index (PPUT) against the S&P 500 Index. With lower equity exposure than the S&P 500 Index, the put protection strategy unsurprisingly underperformed over the extended history, yielding just under a 400% compounded return in excess of cash versus over 1200% for the S&P 500 Index. Considerable growth was given up in order to hedge downside risk.
Figure 3: Cboe S&P 500 5% Put Protection Index Performance
This figure reports historical performance of the CBOE S&P 500 5% OTM Put Protection Index against the S&P 500 Index. The top panel plots compounded excess returns to each series across the following four periods: Pre-COVID, COVID Crash, Post-COVID Recovery, and the 2022 Bear Market. The lower panel reports summary statistics for the two series across the same four periods.
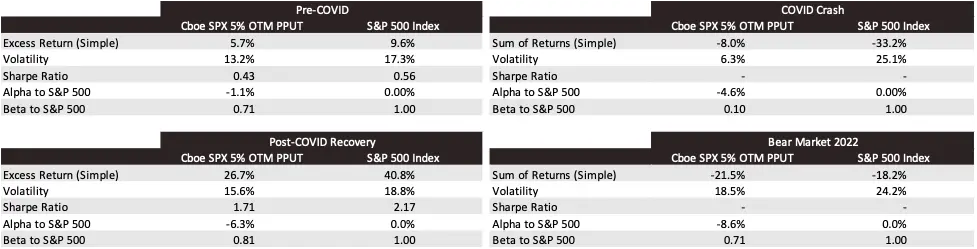
Source: NDVR, Chicago Board Options Exchange, Reuters, French Data Library
During the COVID Crash, the put protection hedge successfully mitigated the equity drawdown with the strategy seeing a loss of about 8% versus over 30% for the S&P 500 Index. The Post-COVID Recovery period was associated with significant underperformance as equities continued to trend higher with little opportunity to monetize the equity hedge.
However, the most interesting and perhaps surprising period was the 2022 Bear Market. During this period, the protected strategy underperformed the S&P 500 Index! The S&P 500 Index was down 18.2%. Meanwhile, the put protection strategy was down 21.5%, losing 3.3% more than the index it was intended to protect. That sounds bad, and in fact several news stories have been written about PPUT’s poor performance in 2022, but when put into appropriate context, the results are even worse than they appear at first glance. The PPUT benchmark realized a 0.71 beta to the S&P 500 Index in 2022, which matches its long-term Pre-COVID equity beta. PPUT underperformed the S&P 500 Index by 3.3% but realized a -8.6% (non-annualized) alpha in 2022. The title to Israelov (2019)’s paper, “Pathetic Protection: The Elusive Benefits of Protective Puts,” seems fitting.
To better understand the drivers of performance, we decompose the performance of the put protection strategy using the methods described by Israelov and Nielsen (2015a). Figure 4 plots and reports the decomposed performance of an S&P 500 5% OTM Put Protection strategy. The S&P 500 Index serves as a benchmark. The Passive Equity Hedge component captures the returns arising from the average put option delta. The Timing Equity component captures the returns arising from deviations in equity exposure around its mean. The Delta-Neutral component captures the convexity-associated returns. And Total is the return of the Put Protection strategy as a whole.
Figure 4: Protective Put Performance
This figure reports historical protective put performance alongside with its performance decomposition into four components. The S&P 500 Index series (S&P 500) is the standalone S&P 500 Index return. The Passive Equity Hedge (PEH) series captures the additional passive equity return brought by the average put protection delta. The equity timing (ET) series carries equity returns explained by the time varying delta. The Delta-Neutral (DN) series corresponds to the delta-hedged portfolio. Finally, the sum of the four components return is referred as Total. The top panel plots cumulative arithmetic returns to each series across the following four periods: Pre-COVID, COVID Crash, Post-COVID Recovery, and the 2022 Bear Market. The lower panel reports summary statistics for the five series across the same four periods, against the S&P 500 Index.
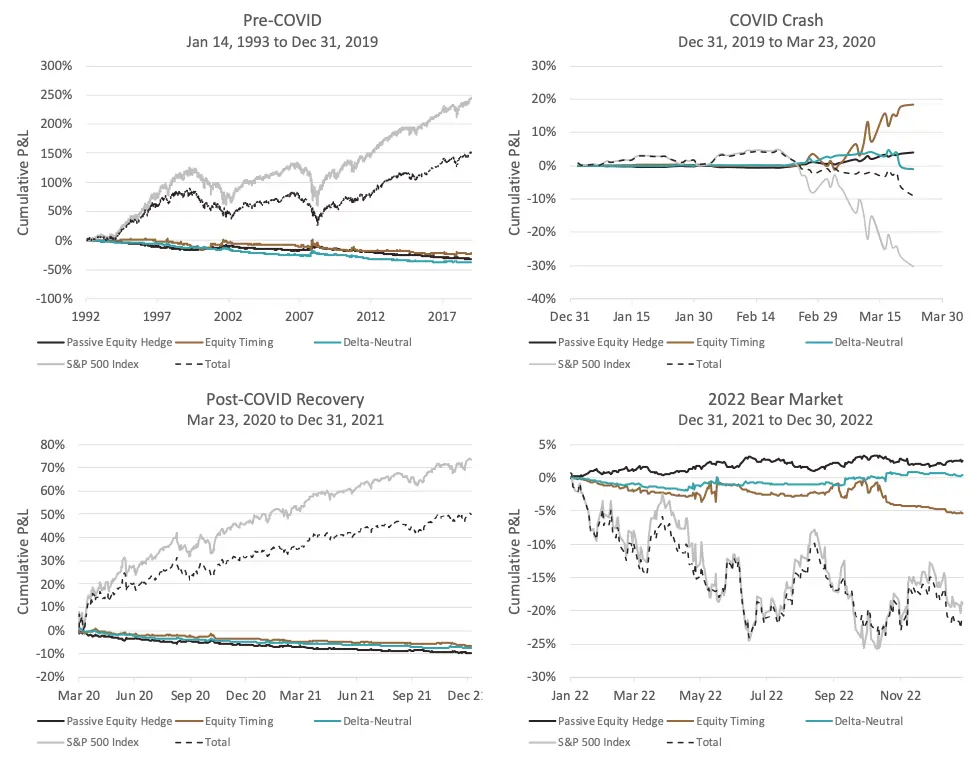
Source: NDVR, Chicago Board Options Exchange, Reuters, French Data Library
In the Pre-COVID period, we see – as expected – that reduced equity exposure and delta-neutral convexity were negative contributors to performance. Equity timing positively contributed to performance indicating that some intra-month trends occurred on average that benefited the long put option position.
During the COVID Crash, the passive equity hedge and the equity timing exposure both positively contributed to performance. However, the pure long volatility exposure as captured by the Delta-Neutral component detracted from performance. This finding is like what we reported in Figure 1 for the long volatility with options strategy. Whatever hedge that put protection provided during the COVID Crash could have been captured by trading equities and excluding options. The option-specific performance hurt performance during this period.
The strategy behaved during the Post-COVID Recovery period much as it did during the Pre-COVID period. The negative passive equity exposure detracted as did the long volatility exposure captured by the delta-neutral component. Equity timing helped due to the trendy nature of the recovery.
Finally, we consider the 2022 Bear Market period in which put protection’s hedging performance was disappointing. The passive equity hedge delivered, but this result is purely mechanical. Long volatility was a relatively unimportant contributor to performance during the period, slightly up (+0.4%) over the full period – this result is consistent with our analysis of long volatility with delta-hedged equity options over the same period. It is the equity timing component that was so helpful during the COVID Crash that hurt performance during 2022, contributing -5.8% of return which is -8.4% of alpha over the period.6
Results: Long Volatility with VIX Futures
A third approach to tail risk hedging seeks to hedge against spikes in (implied) volatility, and a long position in VIX futures provides convenient exposure to implied volatility. VIX futures have no mechanical exposure to realized volatility, other than the empirical property that implied volatility and realized volatility are correlated. VIX futures also have no mechanical delta exposure to the S&P 500 Index, but implied volatility has tended to negatively correlate to S&P 500 returns.
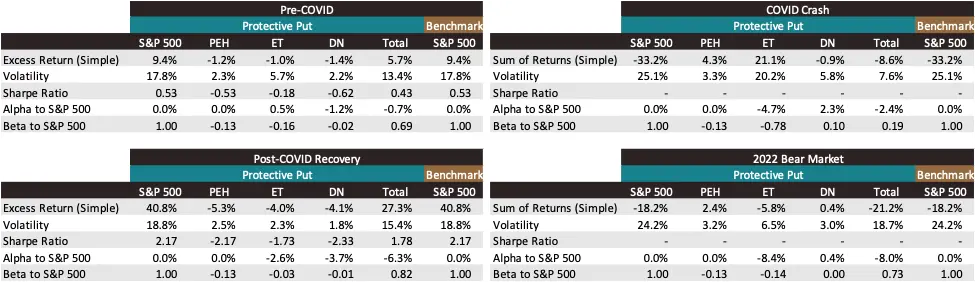
Figure 5 reports the properties of the long VIX futures strategy (in volatility) points over the four respective periods. Over the historical period beginning in 2008, long VIX futures realized a negative 6.8 volatility points of annualized carry with 14.6 points of annualized volatility resulting in a Sharpe ratio of -0.47. The strategy has significant negative equity beta (it’s a hedge of affine S&P 500 return risk too), and its annualized alpha was -1.4 volatility points.
Figure 5: Long VIX Futures Performance
This figure reports historical performance of the VIX Futures Index, constructed as an overlay of a single long VIX Futures contract. The top panel plots cumulative P&L in volatility points to each series across the following four periods: Pre-COVID, COVID Crash, Post-COVID Recovery, and the 2022 Bear Market. The lower panel reports summary statistics for the time series across the same four periods, against with the S&P 500 Index.
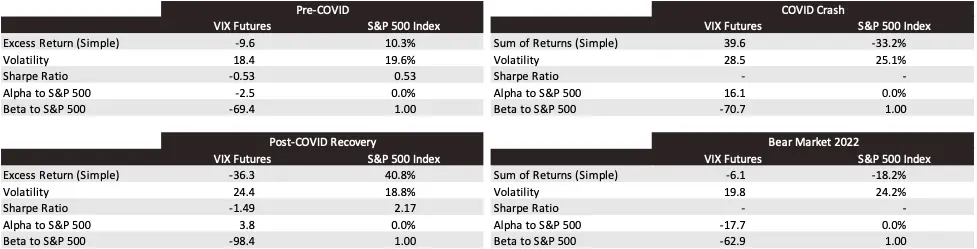
Source: NDVR, Chicago Board Options Exchange, Reuters, French Data Library
During the COVID Crash, long VIX futures returned just over 33 volatility points which recovered about five years of average annualized historical losses. Its alpha over this period was strong, responsible for over half of its realized returns.
During the Post-COVID Recovery period, long VIX futures realized significant losses. With annualized returns of -26.3 volatility points, the strategy more than gave up its gains during the COVID Crash. However, given its correlation to equity markets, the strategy realized positive alpha over this period of nearly eight volatility points. Judging its performance is a matter of perspective. Significant hedging losses arose out of its negative equity beta during a period of strong equity performance, which were modestly offset by strong realized positive alpha.
The bear market of 2022 was a disappointing period of hedging performance for the long VIX futures strategy. Despite having significant negative equity beta, the strategy lost over six volatility points during this period due to nearly -18 volatility points of alpha.
In this regard, the long VIX futures hedge behaved similarly to put protection. Both strategies have negative equity exposure. Both strategies have long volatility exposure. Equity markets were down. Realized volatility was up. And both strategies lost money, exacerbating the losses of the asset they were intending to protect.
Conclusions
Tail protection is complex and fraught with risk. The types of tail protection strategies that can be implemented are only limited by one’s imagination. We investigate three common, yet different approaches to hedging equity drawdowns and a few themes emerge.
First, hedging is expensive. If a hedge includes negative beta to equities, then the hedge is fighting the equity risk premium, which detracts from performance. Efficient markets require this to be the case, and we observe the put protection and long VIX futures hedging strategies, each of which have negative equity beta and have delivered negative returns on average. A convex hedge is long volatility and is thus fighting the volatility risk premium, which also detracts from performance. A long position in delta-hedged options, in VIX futures, or in protective put options has delivered negative alpha on average corroborating the volatility risk premium drag.
Second, the variable equity exposure embedded in option strategies is a source of risk and path dependence. At times, when equity markets trend and do so in alignment with option expiration dates, the variable equity exposure can improve the hedging quality of the long options positions. Such a result occurred during the COVID Crash when the equity trough occurred near the option expiration dates. At other times, when equity markets mean-revert or their trend is misaligned with option expiration dates, the variable equity exposure can detract from performance. Such a result occurred during the bear market of 2022 when the variable equity exposure led the protective put strategy to exacerbate the S&P 500 Index’s drawdown.
Third (and related to the previous point), a hedger’s decision on whether to delta-hedge their option exposure to isolate the option convexity or to maintain an unhedged position materially impacts performance in non-forecastable ways. The option delta-hedger would have seen nearly no tail-risk hedging benefit during the COVID Crash but would have seen materially improved performance during the 2022 bear market.
Finally, there is enormous dispersion in the performance of tail risk hedging strategies. Well-reasoned arguments can be made in favor or against any number of decisions on how to implement a tail risk hedge. We only considered a few strategies (long options hedged or unhedged, long put protection, and long VIX futures) and the dispersion in outcomes is notable. Each implementation hedges against different types of events. Finding a panacea for all types of drawdowns (other than simply reducing allocations to equities) seems unlikely.
The debate on if and how to hedge equity tail risk is seemingly never-ending in the volatility community. We have no expectation that our results will help to settle the debate. Some might argue that finding a hedging solution that doesn’t do more damage than it mitigates is a lost cause. Others would argue that the dispersion in efficacy favors an ensemble approach that diversifies the hedges and increases the likelihood of having at least one hedge that pays off in any type of realized drawdown. Others will claim that our limited examination of hedging strategies excluded the specific types of tail hedges that are most efficacious.
We acknowledge all these arguments and end with our conclusion that there is likely no easy solution for tail risk hedging and that those who implement hedging solutions should plan for the possibility – as remote as it might be – that their hedges make things worse in times of stress.
References
Cheng, I. 2018. “The VIX Premium.” The Review of Financial Studies 32 (1): 180—227.
Hu, G. and K. Jacobs. 2020. “Expected and Realized Returns on Volatility.” Working Paper.
Israelov, R. and B. Kelly. 2017. “Forecasting the Distribution of Option Returns.” Working Paper.
Israelov, R. and H. Tummala. 2017. “Which Index Options Should You Sell?” Working Paper.
Disclosure
Roni Israelov is President and Chief Investment Officer at NDVR, Inc. E-mail: roni.israelov@ndvr.com. David Nze Ndong is a Research Associate at NDVR, Inc. E-mail: david.ndong@ndvr.com.
This material is published for informational purposes only.
The views expressed and other information included are as of the date indicated and based on the data available at that time. They may change based on changes in markets, general economic conditions, rules and regulations, and other factors. NDVR does not assume any duty to update any of the views and information herein. Unless otherwise noted, views and opinions expressed are those of the authors and not necessarily those of NDVR or its affiliates.
NDVR is an investment advisor that may or may not apply the views and other information described herein when providing services to its clients. The views and information herein are not and may not be relied on in any manner as, investment, legal, tax, accounting or other advice provided by NDVR to any individual or entity or as an offer to sell or a solicitation of an offer to buy any security.
Footnotes
-
Israelov and Klein (2016) investigate the risk and reward properties of Cboe benchmark collar indices, which partially or fully finance a protective put option by selling an out-of-the-money call option. Buckle (2022) derives theoretical properties for protective put and covered call strategies, both from the protective lens. Haghani et al. (2022) investigate whether investor welfare can be improved by including options in their portfolios and find that for the representative investor, the benefits are quite small. ↩
-
VIX futures also have exposure to the (implied) volatility risk premium. Simon and Campasano (2014) investigate harvesting the volatility risk premium by shorting VIX futures and extend the harvesting strategy to hedge the VIX futures position with S&P 500 index futures. Cheng (2018) investigates the properties of the VIX Premium and finds that ex ante premiums reliably predict the ex post VIX futures returns. Van Tassel (2020) finds that the prices of VIX futures are often above their option-implied upper bounds, providing evidence of heightened volatility risk premium in VIX futures markets. Hu and Jacobs (2020) derive expected volatility returns from VIX futures and find that they are always negative. ↩
-
Bakshi and Kapedia (2003) demonstrate the volatility risk premium through the properties of delta-hedged option returns. Garleanyu et al. (2009) provide a demand-based option pricing framework to theoretically motivate the volatility risk premium. Ilmanen (2012) further motivates the volatility risk premium using investor preferences for lottery ticket payoffs. Fallon et al. (2015) show that institutional investor portfolios would benefit by incorporating modest allocations to short volatility strategies intending to harvest the volatility risk premium. Israelov and Nielsen (2017b) show that the volatility risk premium has historically been heightened (when measured as the percentage difference in implied and realized volatility) in low volatility environments. Israelov et al. (2017) find that, even for those investors who are concerned about the risk of sizable drawdowns, selling options rather than buying them might be the more effective solution due to the volatility risk premium. ↩
-
Only a couple of years prior, another volatility event (colloquially named as Volmageddon) resulted in significant destruction of capital for short volatility investors through exchange traded products. Augustin et al. (2021) investigate the February 5, 2018 Volmageddon event and consider the risk management implications of levered exposures on financial stability.5 Only a couple of years prior, another volatility event (colloquially named as Volmageddon) resulted in significant destruction of capital for short volatility investors through exchange traded products. Augustin et al. (2021) investigate the February 5, 2018 Volmageddon event and consider the risk management implications of levered exposures on financial stability. ↩
-
Harlow et al. (2022) consider incorporating a delta-hedging program to tail hedges to reduce the return drag of the negative equity exposure. The convexity exposure of our put protection implementation and our delta-hedged long volatility implementation with options are like their delta-hedged implementation. ↩
-
Although the performance of our replicated Cboe S&P 500 5% OTM Put Protection Index using iVolatility is largely in line with the Cboe Benchmark Index, we see a slight difference in performance during 2022, where the replicated strategy realized -8.0% alpha with 0.73 beta vs. -8.6% of alpha with 0.71 beta for the Cboe benchmark index. However, none of our conclusions are impacted by these differences. ↩